
Databases
 |
|
|
IGCP 509 project participants will use data from two databases, both of which are available from the IGCP 509 web site and from the database page of the Saskatchewan Isotope Laboratory (SIL). These databases are:
The IGCP509 database will form the principal mechanism to facilitate the construction of time-space correlation charts for the project. Details are provided elswhere on this web site of how to contribute data and to construct the time-space correlation charts, utilising information in IGCP509 and DateView. The documentation on this page is also available as an Adobe pdf. |
|
Log In or Register as a New User
If all has worked as it should, you will see the following window. |
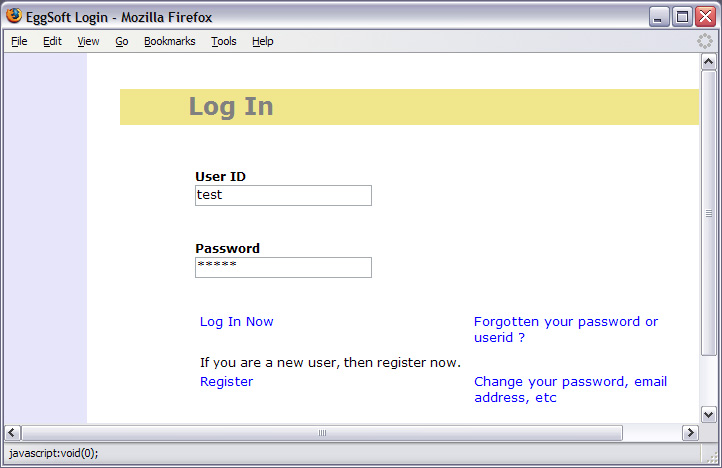 |
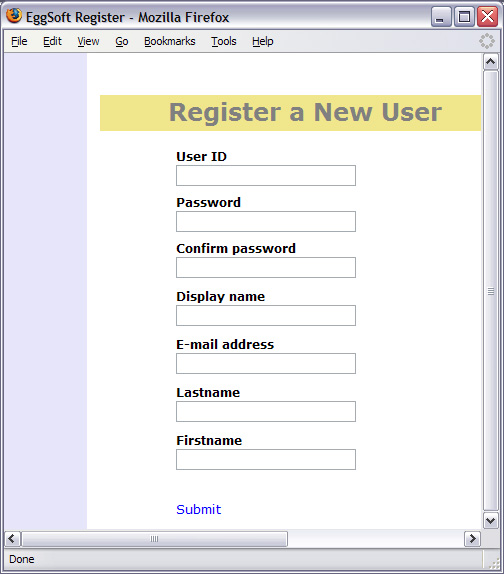
If you are a new user and have not previously used either DateView or IGCP509/StratDB, then you will need to register with the system. Registration and use of the database systems is free, but various levels of access permission are provided in the different database systems, depending on whether one will contribute data or not. For some databases, for instance in DateView, users may capture their own, confidential information. The database needs to know who you are to manage this process. If you have forgotten your password, clicking on the appropriate link in the log-in screen will email the details to the email address provided during registration. If you change address, please update you details in the database. |
 |
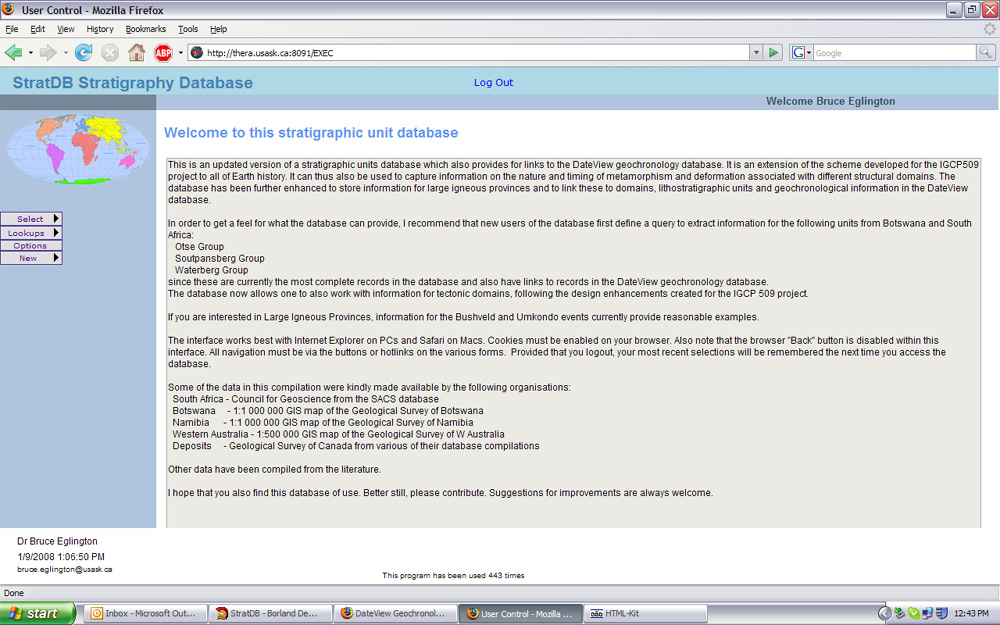
Once you have logged in to the database, you will see the Main Menu window (see below). Top-level hot-links to the various components of the database interface are provided on the left and a window with messages about the current state of the database appears on the right. Be sure to log out from the system, using the "Log Out" hot-link at the top of any screen if you want to save your query definitions for when you return another time. Please note that browser navigation behaviour in this interface is somewhat different to that in most browsers. Specifically, the browser's "Back" button is disabled and all navigation needs to be performed using buttons or hot-links provided on the various forms. This is done to ensure that 'state' information is carried across from one form to another, which facilitates keeping track of the user's personal queries and preferences. |
 |
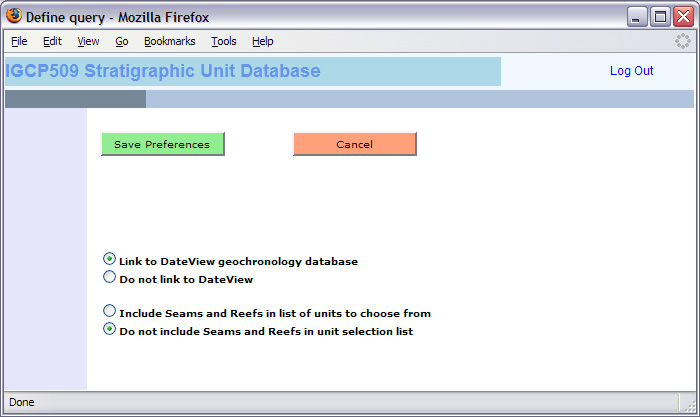
One of the first things to do when using the IGCP509/StratDB interface for the first time, is to set up your personal preferences. This is done by clicking on the "Options" hot-link. This will bring up a window in which you can specify whether you want to see linked data from the DateView geochronology database and the level of detail required when running lithostratigraphic queries. |
 |
Querying the Database
|
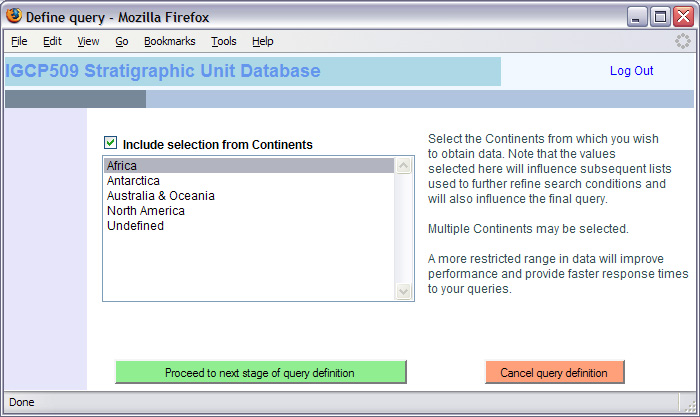
Please note that a more refined query will take less time to execute that one which returns a huge amount of information. You, as user, will need to choose an optimum degree of detail to specify in your query. Many users tend to overspecify their queries with too much detail. Rather start broader, and then focus in by refining the query with additional search field constraints. |
 |
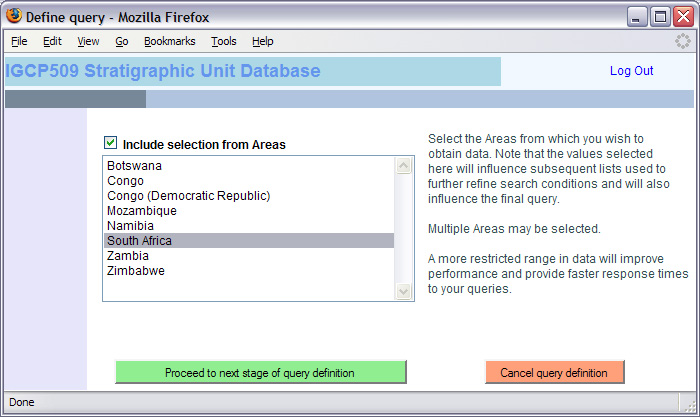
You will now be prompted with a list of countries within the continents you selected. You will notice a checkbox at the top left of the list of countries. Similar checkboxes appear in many other query definition forms. You must check this box if you want to include the field in a query. this checkbox is provided to facilitate repeat queries in which users want to include/exclude particular fields without continually needing to search for and check all items in the list.You may select one or more countries or, in this case, none (do not check the checkbox if this is what you want). Omitting any countries from the selection will effectively select data from all the countries in the selected continents. |
 |
|
|
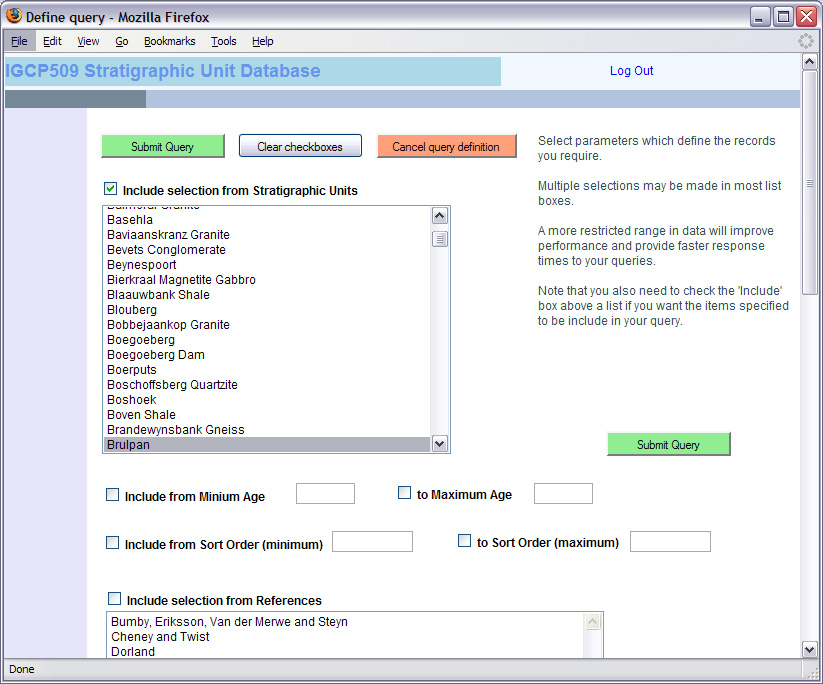 |
At this point, you will be provided with a list of lithostratigraphic units which matched your query conditions, arranged in pages of twenty-five results per page. |
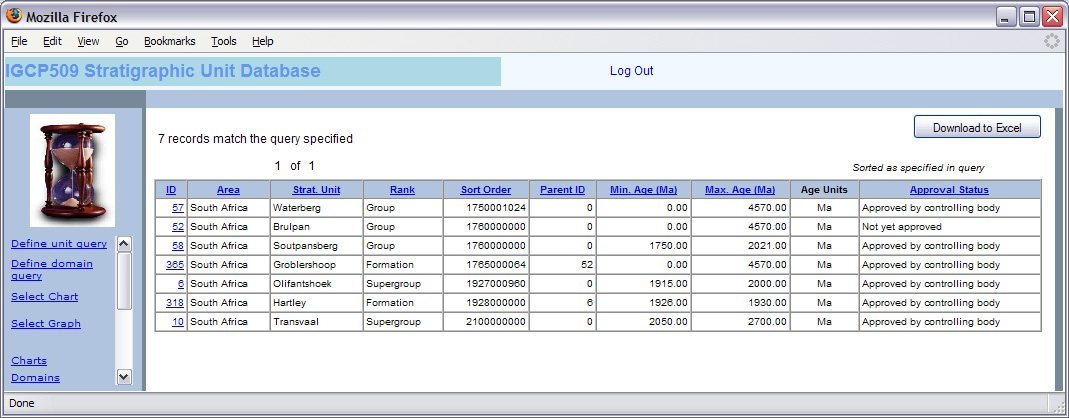 |
It is possible to change the sort order of the results by clicking on the heading of an appropriate column in the results grid. Alternatively, one may drill down to more detailed information for each selected unit by clicking on the hot-link unique ID at the left of the grid. Once one has drilled down to a specific unit,one may navigate up and down the hierarchical relationships captured by clicking on appropriate hot-links or buttons. A button also provides an Excel download of all the selected units and their hierarchically organised subordinate units. More details of this capability are provided below. |
 |
Download hierarchical Information from the Database
Once you have defined and run a query, it is possible to download aspects of the results to an Excel spreadsheet. These include the hierarchical relationships between the various units, as illustrated below. Note that one can minimise 'parent' units so as to limit the hierarchical view in the spreadsheet. |
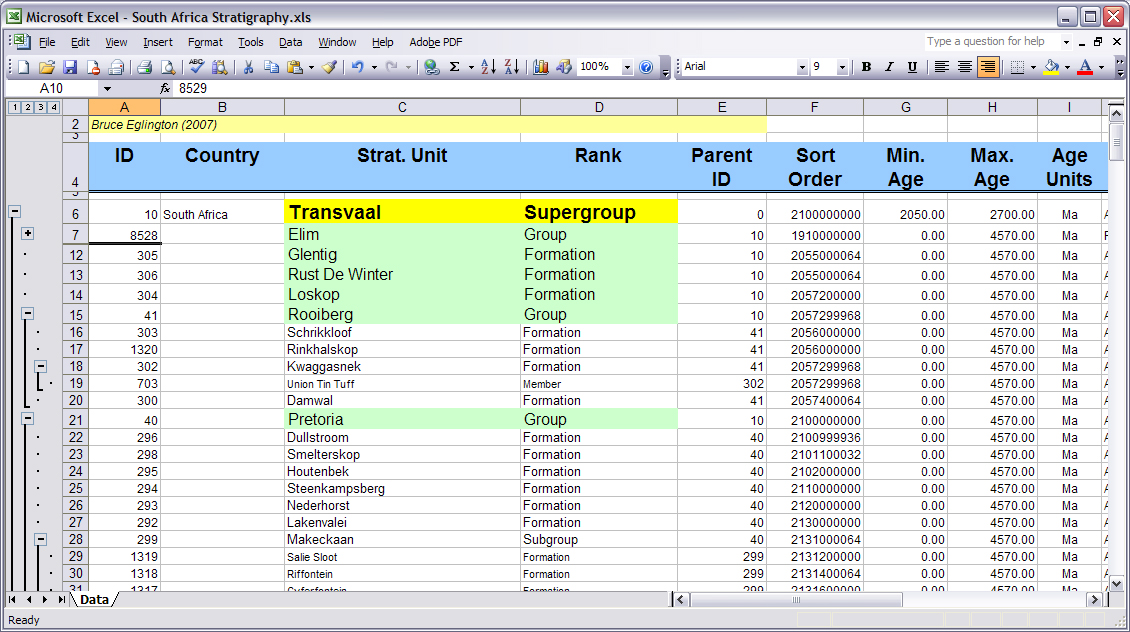 |
An example spreadsheet for lithostratigraphic units comprising the Transvaal Supergroup of South Africa may be downloaded here. |
It is also possible to download equivalent Excel spreadsheet views of the hierarchical relationships between structural domains, Large Igneous Provinces, deposits and of geological timescale subdivisions. |
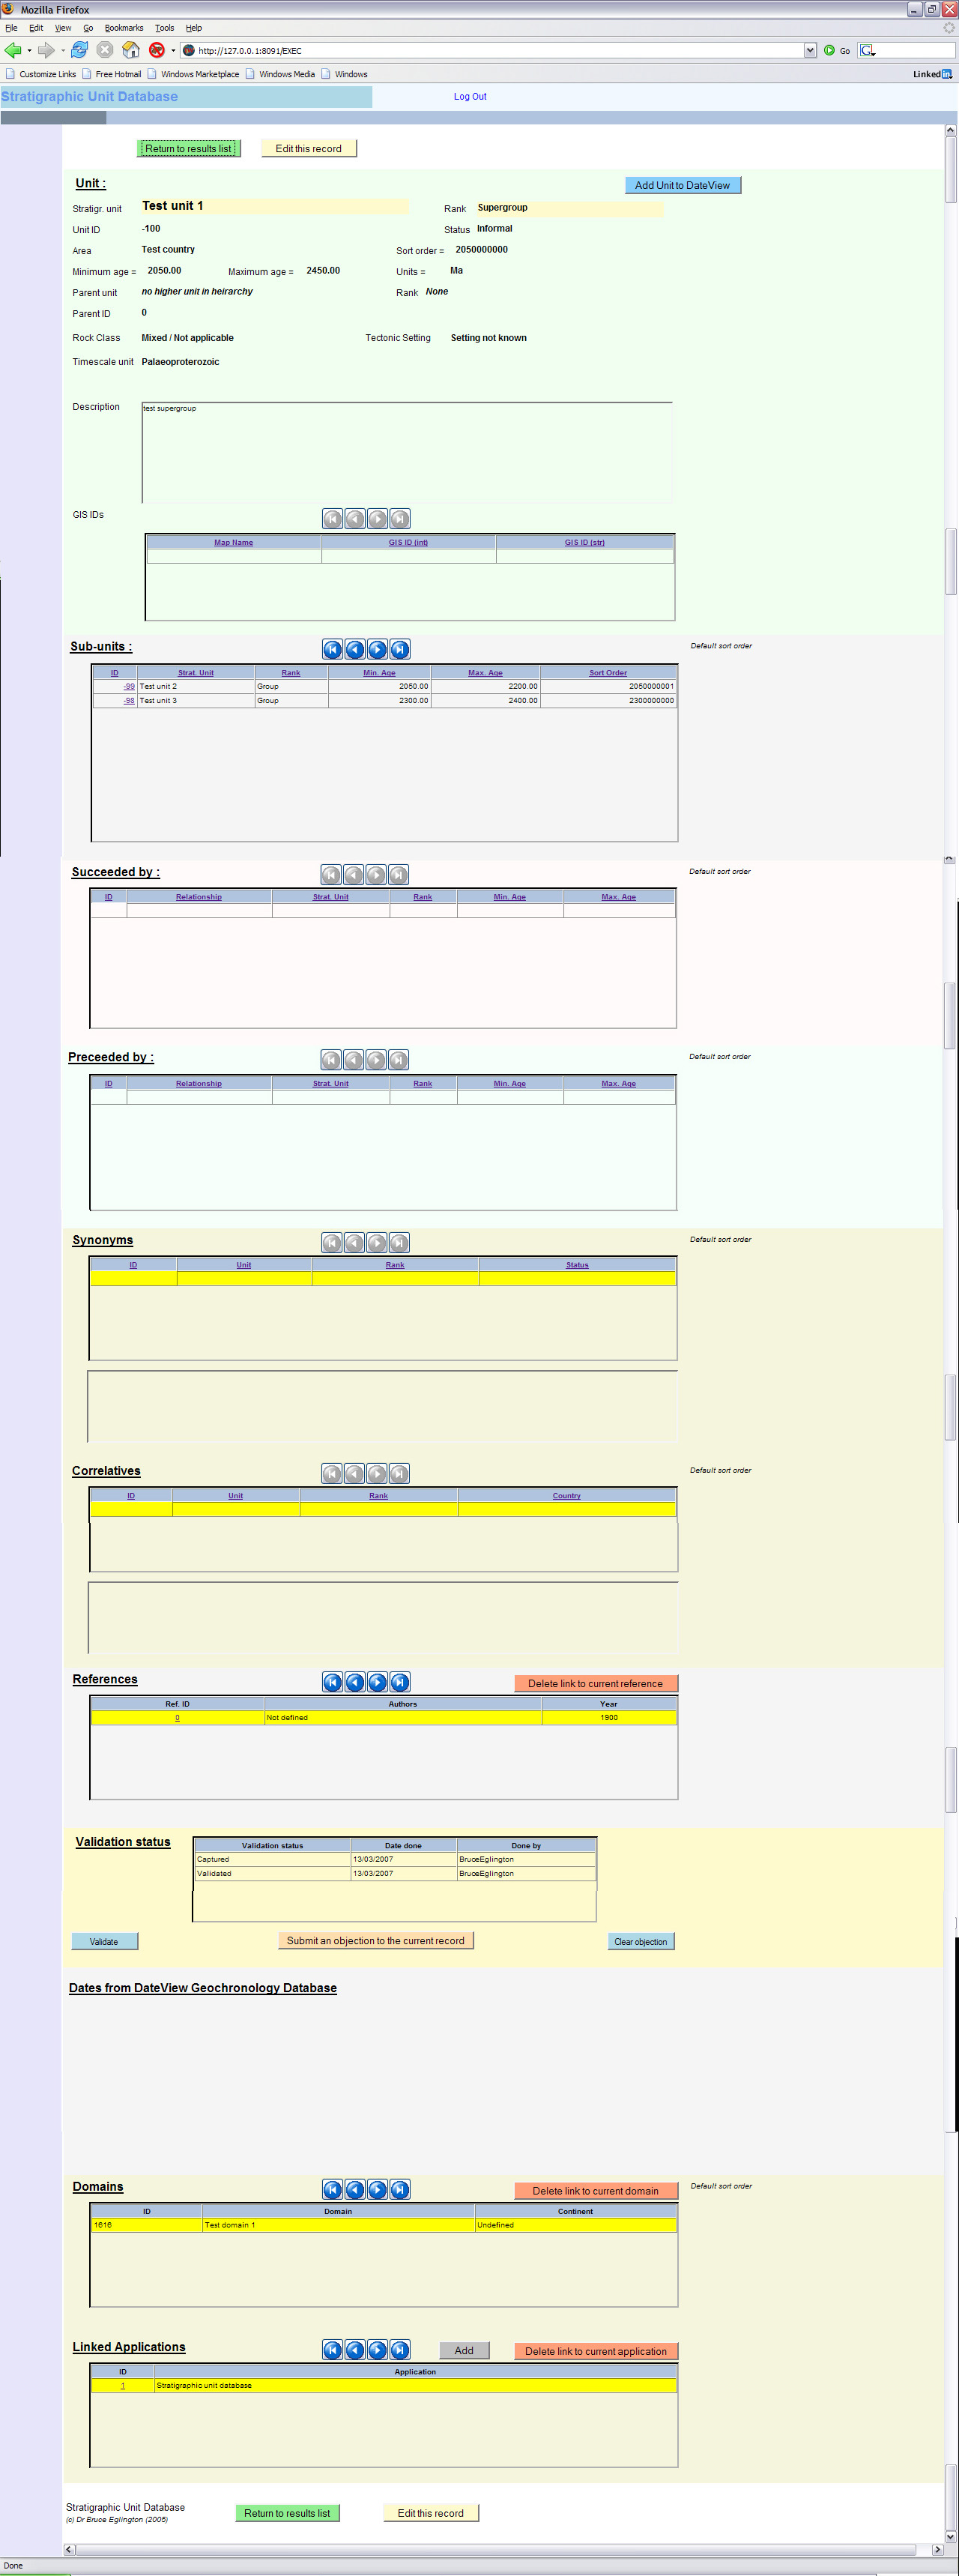
Modifying Information in the Database
Once one has drilled down to a specific unit, one may edit details of the unit if one has been given edit permission by the database administrator. This level of permission is not provided to everybody as there is an increased chance that database records may be corrupted as more users are permitted to change the contents of records. Before you can edit information for a record, you will need to click on the "Edit" button. Once all changes have been made, the "Apply updates" button must be clicked before moving to another record or moving to another form. If this is not done, the changes will be lost. If a mistake is made, clicking on the "Cancel updates" button will return the database information for the current record to the same state it was before editing commenced. Please be very careful during editing as there is no way to reverse a change which has been saved! |
Raise an Objection Against Specific Record Information in the Database
I have also implemented a system to facilitate moderation (termed 'Validation') in the database interface. Various regional coordinators will be assigned the role of checking that the contents of the database are correct in their areas of expertise. Any user may "raise an objection" to any aspect of the current contents and these objections will be adjudicated by the 'Validators' in an attempt to reach a compromise. In extreme cases, this might even entail adding new records to capture distinctly different views of the lithostratgraphy or metamorphic or deformation history of an area. If you feel that you have appropriate local knowledge and are prepared to take on the role of 'Validator', please contact Bruce Eglington. |
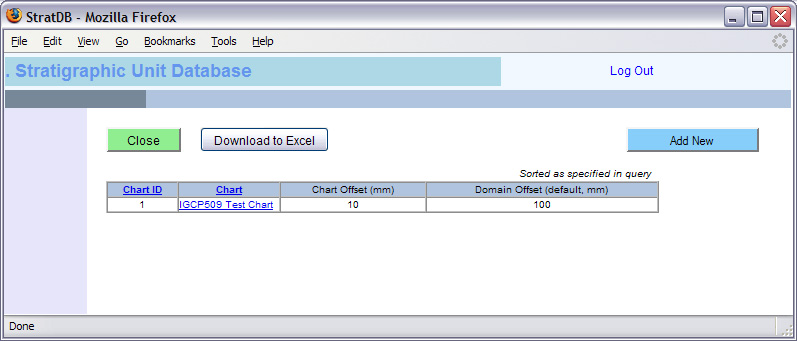
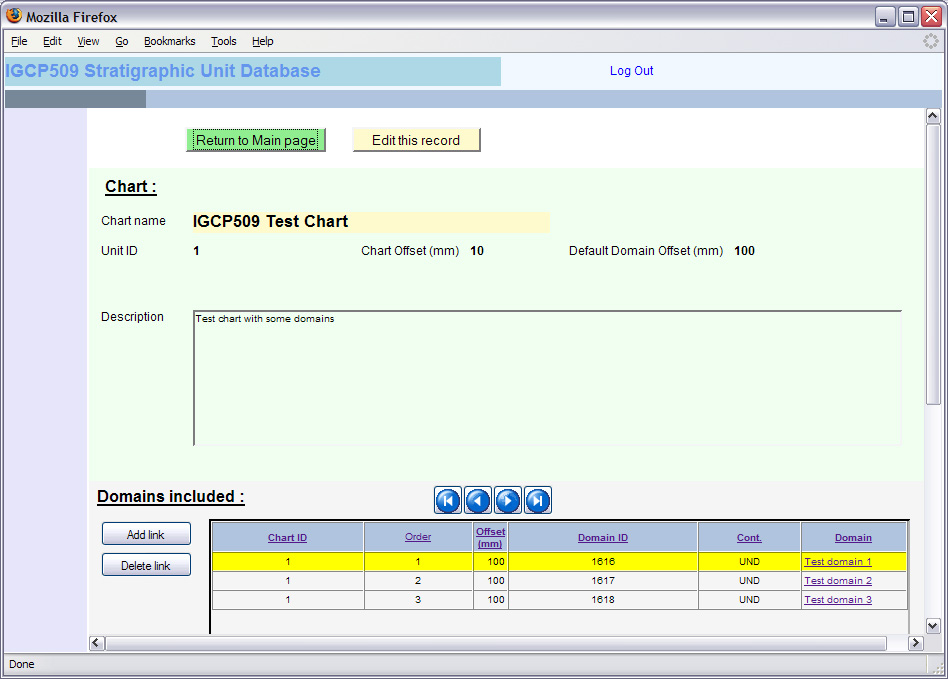
Create a Time-Space Correlation Chart
| One of the major reasons for developing the IGCP509/StratDB database system was to facilitate the compilation of time-space correlation charts for the IGCP 509 project. Individual users may download information suitable for the construction of these charts. The details for each user's chart is stored individually so you cannot overwite somebody else's chart. First, one needs to define a chart name and some basic details. In this way, individuals may draw the information from the database so as to construct any number of charts for different parts of the world or for different domains. The following image shows the window which lists charts defined by a user. |
 |
You now need to assign various domains to a chart. First, one needs to limit the list of domains to a particular continent, as shown below. |
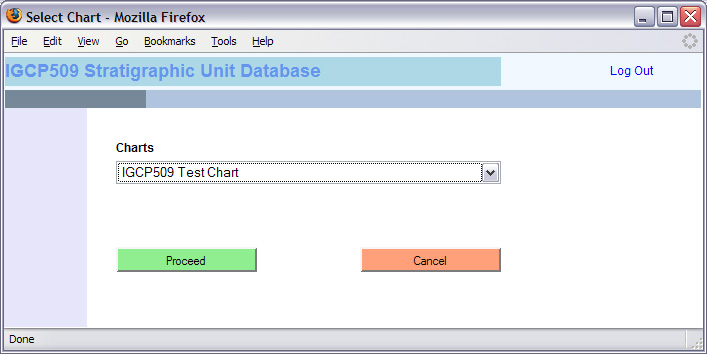 |
Then one must select the domain. |
 |
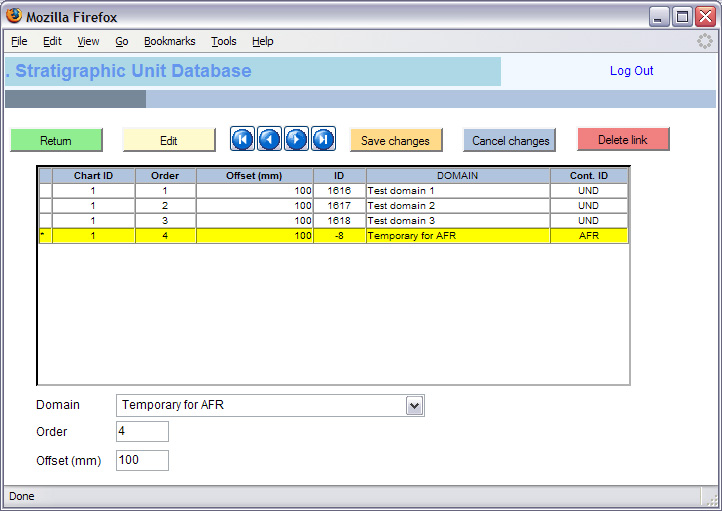 |
Add all required domains in the order you want them (from left to right across the final time-space correlation chart), by iterating through these selection steps for each required domain. |
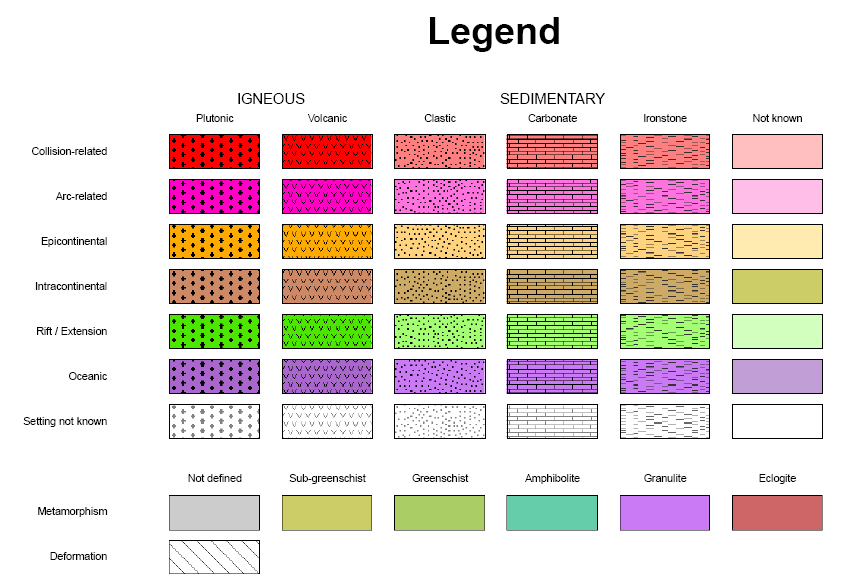
A legend has been designed for the IGCP 509 time-space correlation charts which will, hopefully, permit users to illustrate the fundamental aspects of the development of various regions. The current version of this legend is illustrated below. Please note that this legend will probably change and is shown here to illustrate current thinking and to provide a better understanding of the database design and capabilities. |
 |
Once all domains have been added to a user's chart, all the information required to create the time-space correlation chart should be downloaded into various Excel spreadsheets, using the buttons at the bottom of the Chart Selection window. The details in these spreadsheets may then be imported into a GIS package, as described here. Please do not modify the spreadsheet contents before importing them to GIS. The layout of each spreadsheet is specifically designed to provide all necessary information for creating appropriately coloured rectangles (polygons) and correctly positioned boxes and text. Once imported to a GIS package, such as ARCGIS, the time-space correlation chart will look something like the image shown below. Here, information for a various hypothetical lithostratigraphic units associated with three artifical structural domains have been used to test ideas for chart construction, layout, etc. |
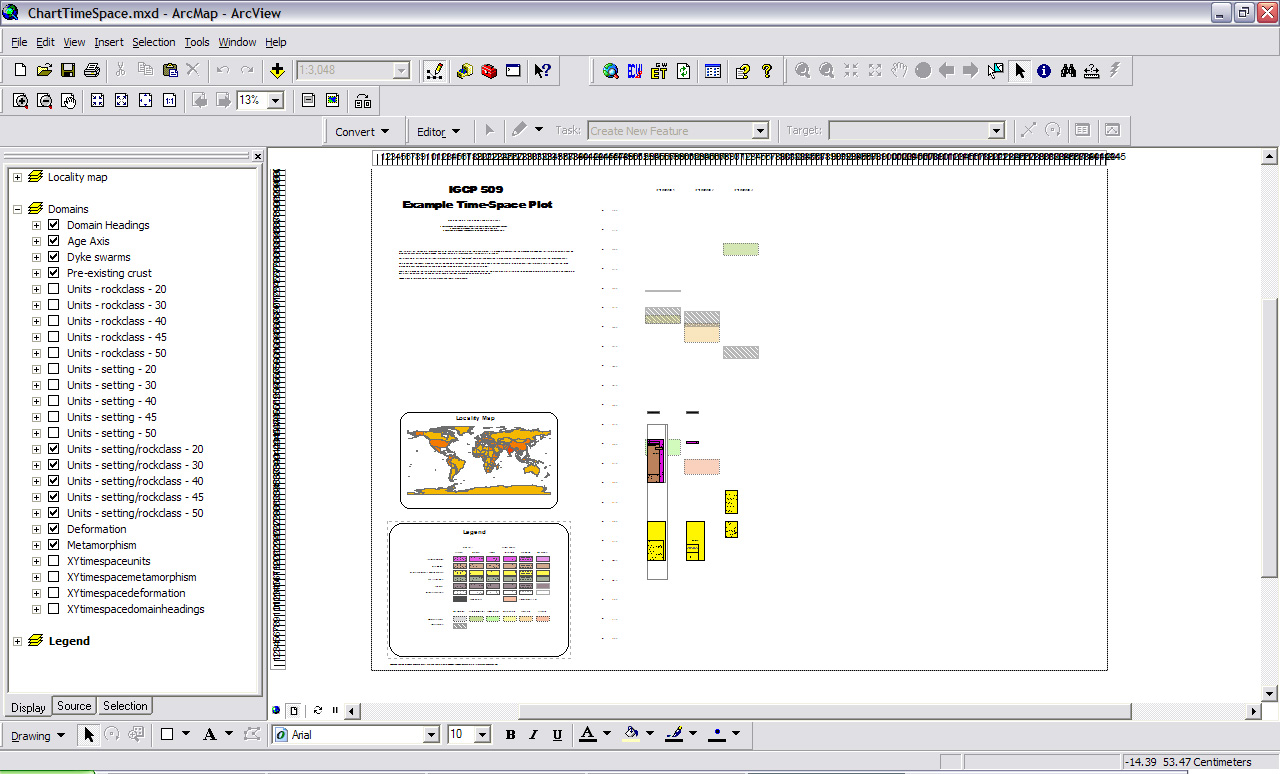 |
And here is an enlarged view of some of the polygons for various units and metamorphic episodes. In this case, unit polygons are colour coded according to their tectonic settings. |
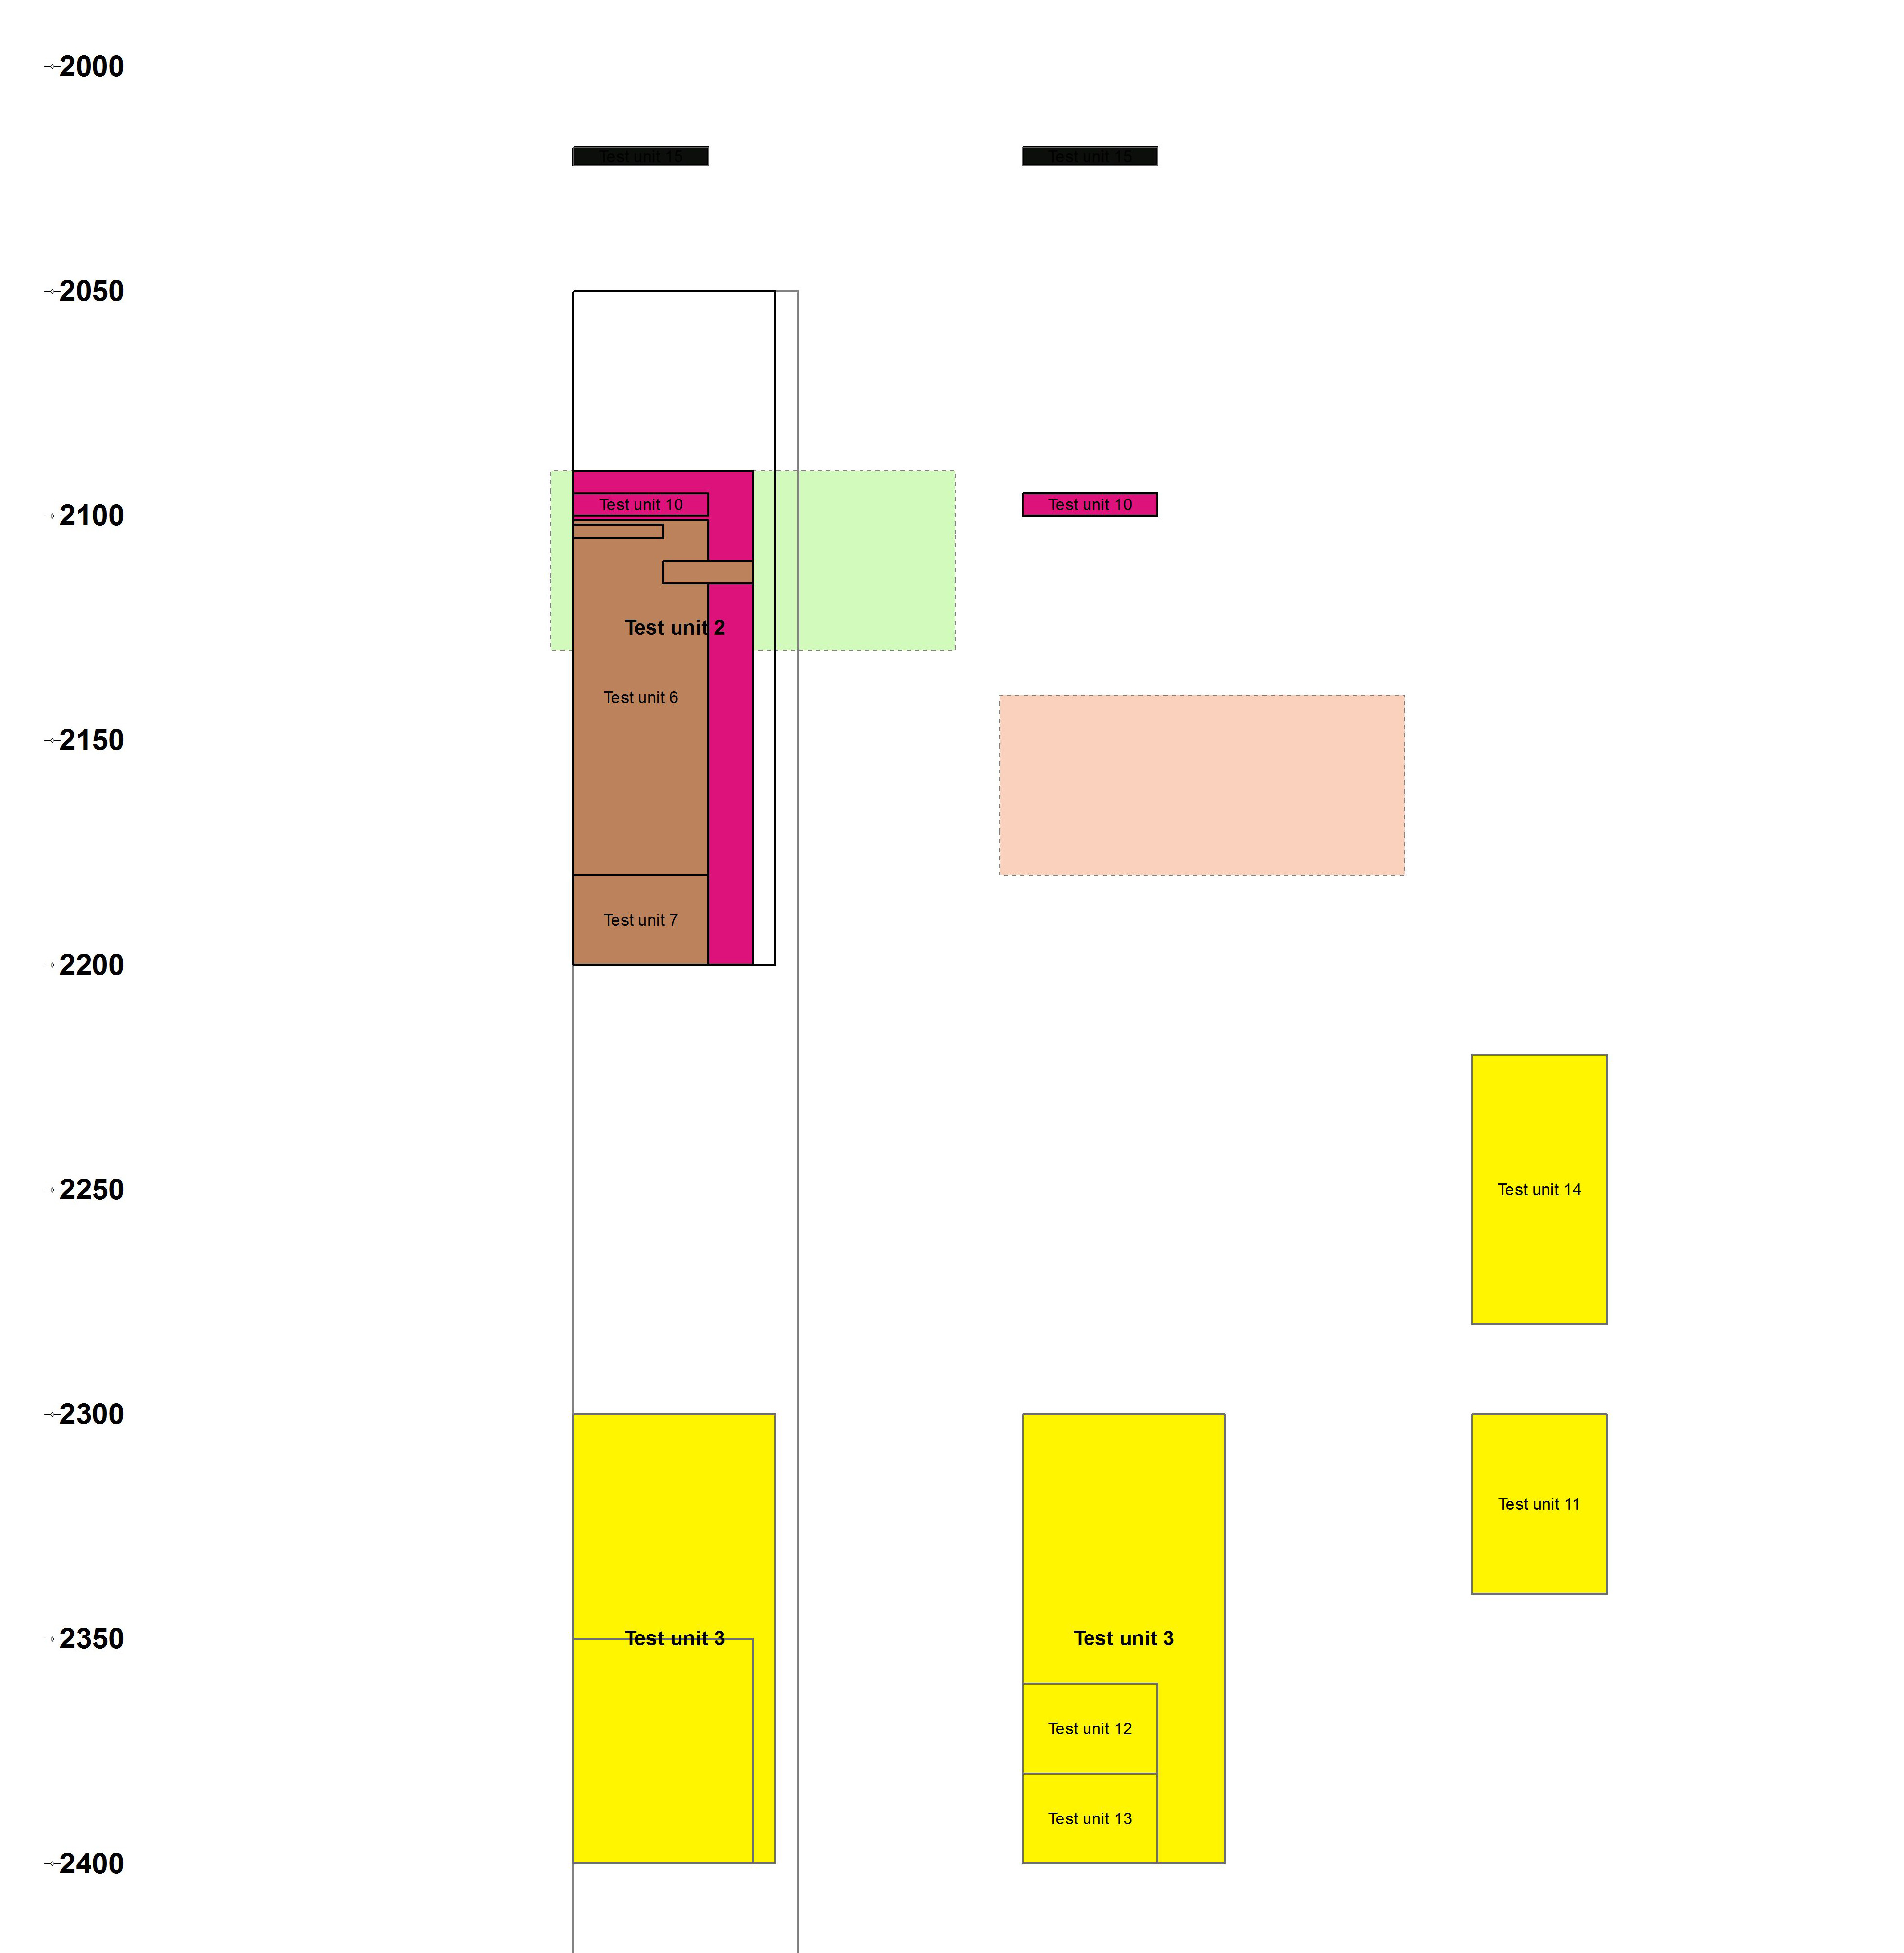 |
More detailed labelling is possible by converting ARCGIS labels to annotation and moving these to optimal positions. Alternatively, annotation may also be added manually. This aspect of the IGCP 509 time-space correlation charting is still under development, so expect to see changes and improvements as the project progresses and we receive feedback and suggestions from project participants. |