
Software Required
 |
|
| Data for the construction of time-space correlation charts may be downloaded from either the IGCP509 or StratDB web interfaces. The former will automatically limit data to the Palaeoproterozoic (+/- one geon), whereas users of the latter web interface will need to impose appropriate age constraints on their own. Output is currently in the form of formatted Excel spreadsheets for semi-automatic importing into ARCGIS 9.x (ArcView). Users will need a licensed copy of MicroSoft Access and of ESRI ARCGIS 9.x (ArcView only). The free ARCGIS plugin component ET Geo Wizards should be installed in ARCGIS if you plan to follow the specific procedures documented elsewhere on this page. Alternative formats for more automated importing to GIS packages are planned for the future, so as to avoid the need for MicroSoft Access and ARCGIS. |
|
Instructions for Importing to ARCGIS 9.x
| The documentation on this page is also available as an Adobe pdf. The procedures described here were tested using MicroSoft Access 2003, ESRI ARCGIS 9.1 and ET Geo Wizards 9.6. You will need to download an ArcMap project file, personal geodatabase file and ESRI style sheet to the computer on which you intend to work. You will also need the various time-space Excel spreadsheets downloaded from the IGCP509/StratDB database. Master and examples versions of all these files are avilable from hyperlinks near the bottom of this page. |
|
First, start MicroSoft Access and import data from the spreadsheets downloaded from the IGCP509/StratDB databases. You will need to overwrite the following database tables in the Geodatabase:
They now need to be recreated. Right-click on the table timespaceunits, select "Create Feature Class", then "From XY table". Accept the default X and Y fields and no field is required for Z. Be sure that the output is directed to a feature class in the database TimeSpaceGeodatabase.mdb (it must not be a shapefile or a file with the extension .SHP). Click on OK. Repeat the process to recreate the other XY� tables. Use ArcToolbox and select "Data Management Tools", "Projections and Transformations", "Define Projection". Define the Coordinate System for each of the XYtimespace� features classes as "Mercator". To do this, click on "Select", "Projected Coordinate Systems", "World", "Mercator (world)", "Add", "OK". Close ArcCatalog and start ArcMap with a blank (New) view. Add the four XYtimespace� tables to the active layer. You will now need to convert the point nodes for each set of polygons in the XYtimespace�feature classes into polygon feature classes. I recommend using the free ARCGIS addon component ET GeoWizards to perform this operation. It's use is illustrated in the images below: |
|
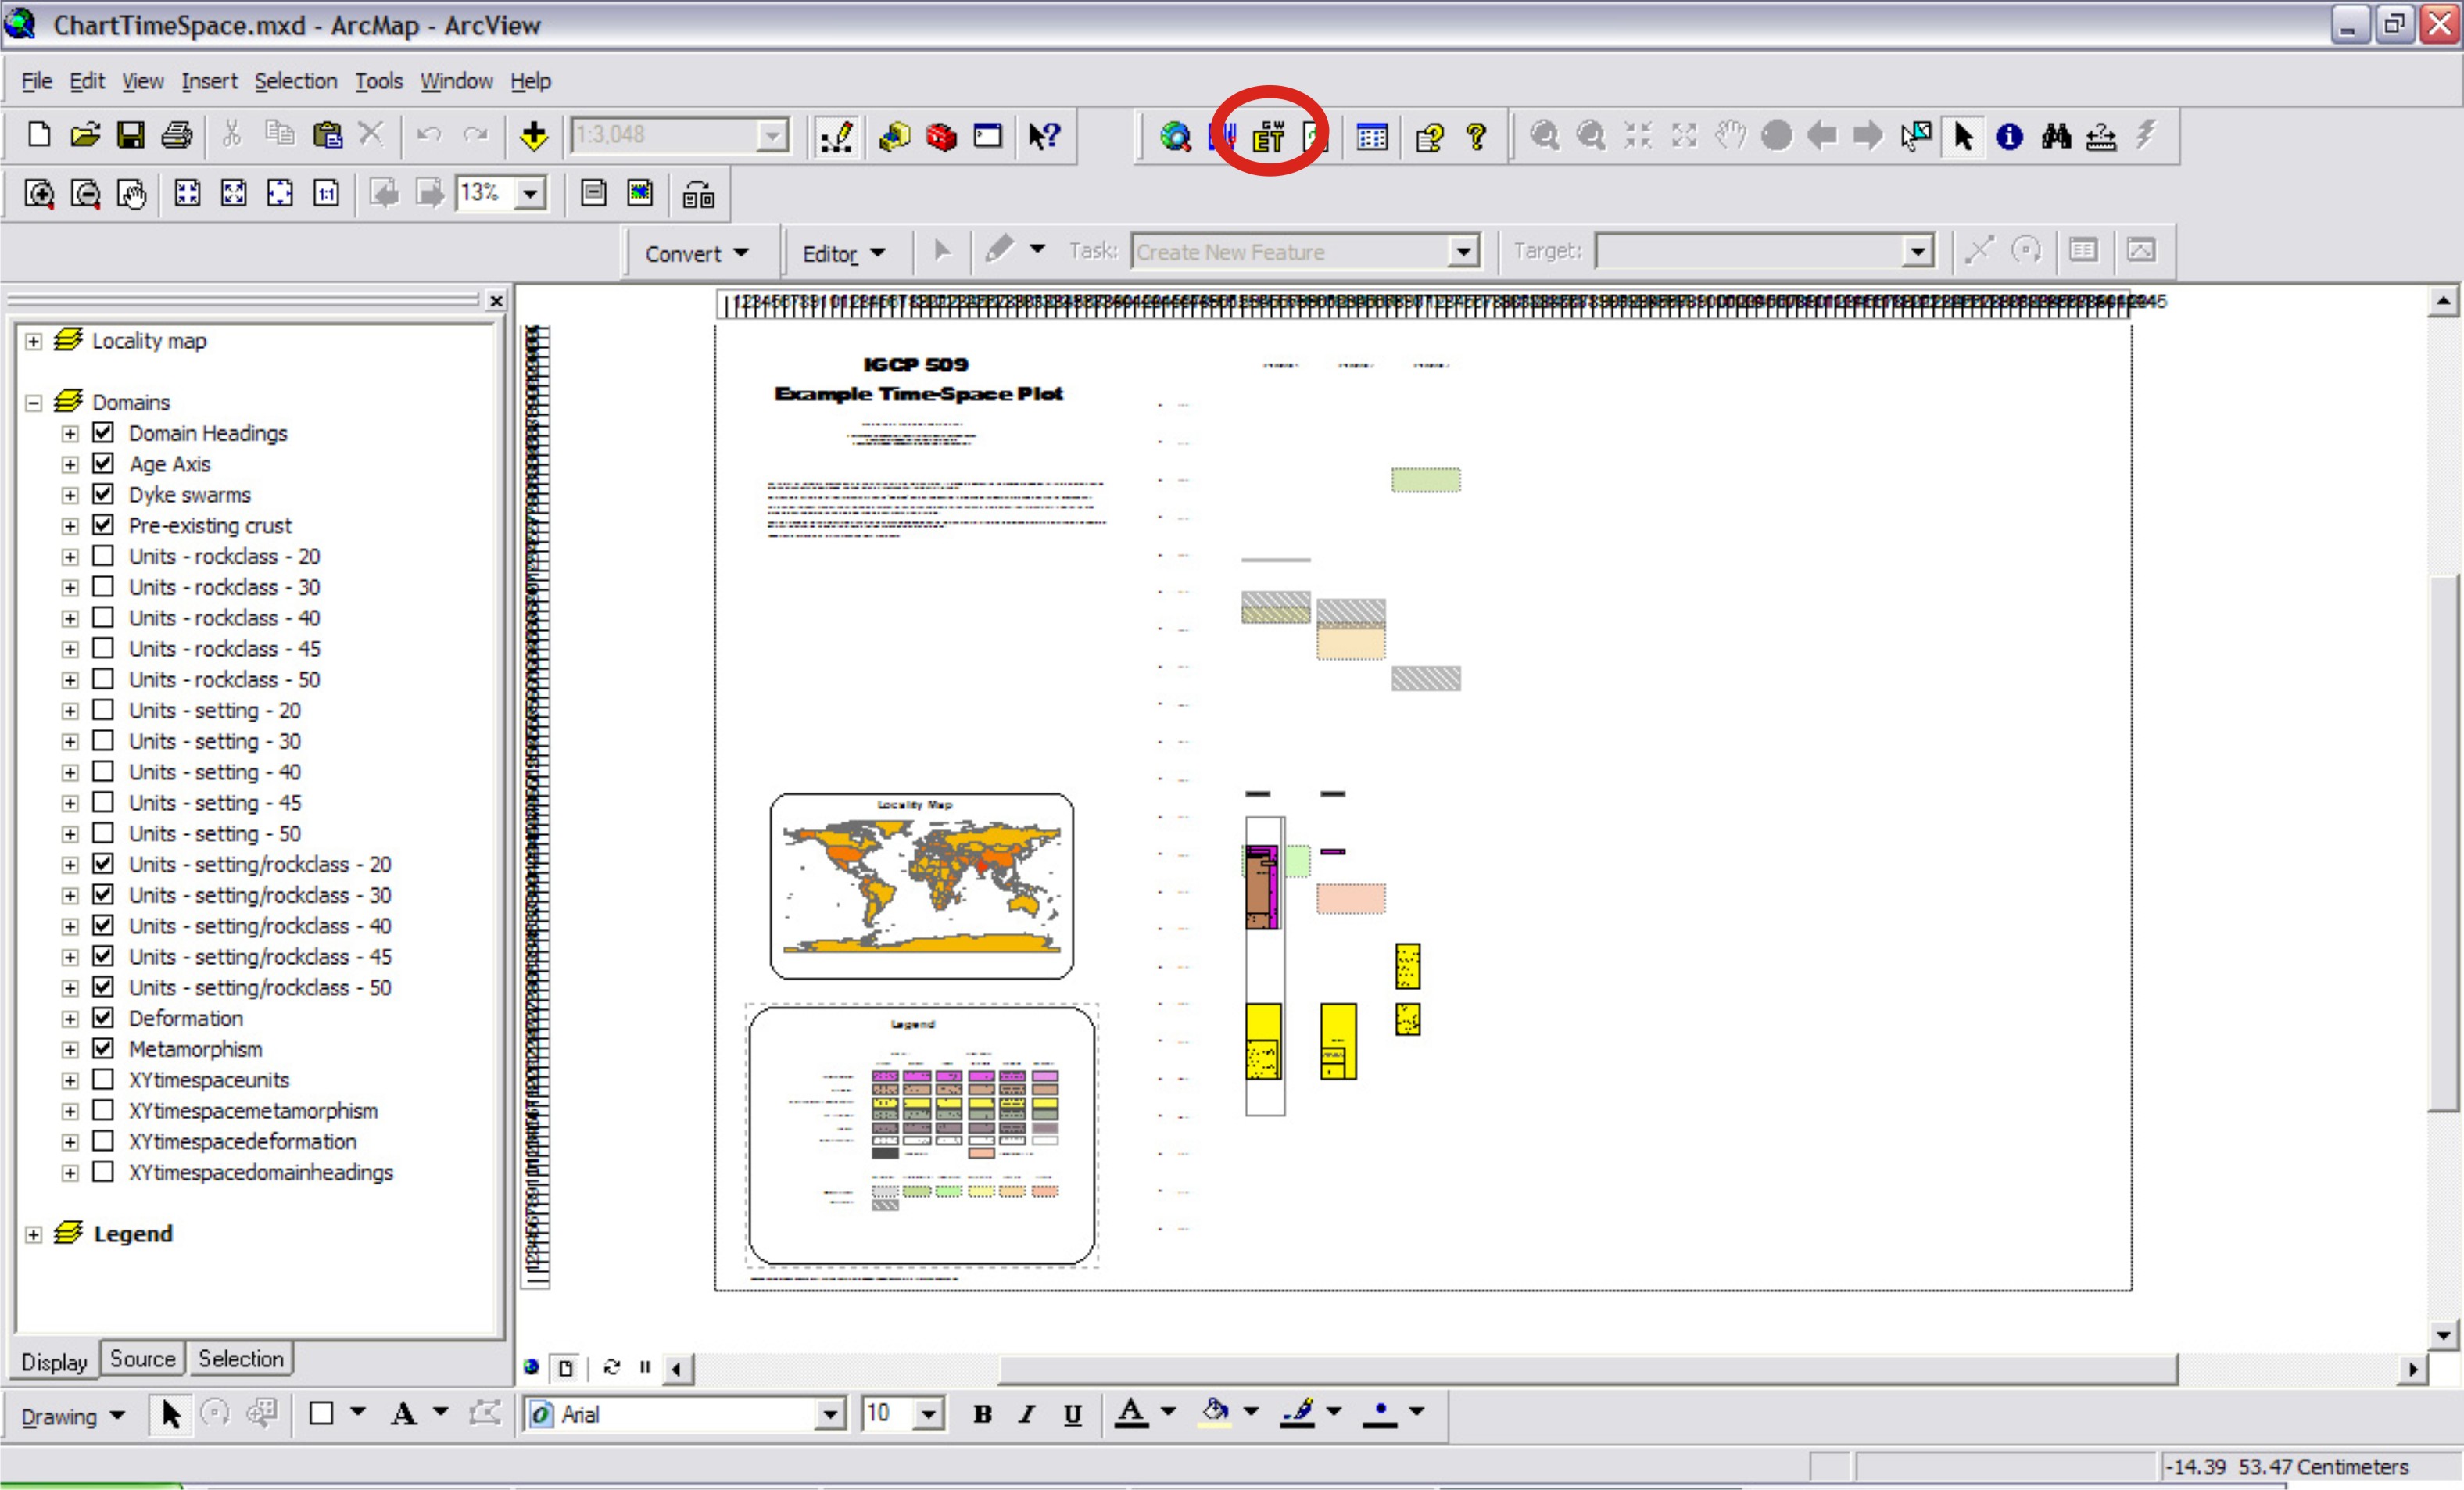
| If you have installed the ET Geo Wizards tool correctly in ArcMap, there will be an icon on the menu bar, like that marked by a red ellipse on the following image. Click on this icon to start the conversion process. | |
 |
|
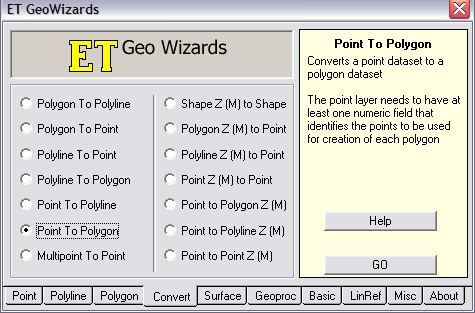
This will open a window, as illustrated below, in which you will need to specify that you are converting from Point to Polygon. Click on the "Go" button. |
|
 |
|
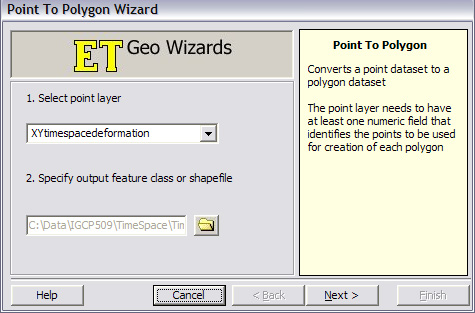
This will open a window, in which you need to select the appropriate XYtimespace... point layer (feature class) and specify a name and storage location for the new (output) polygon feature class. Choose the appropriate polygon feature class table (I have named them ChartPolygon...) for the XYtimespace... feature class that you are converting. Be sure that the output is sent to a feature class in the TimeSpaceGeoDatabase, not a shapefile (if the output has the extension .shp, it will be sent to a shapefile). When asked if you wish to overwrite the current tables in TimeSpaceGeoDatabase.mdb, select "Yes". |
|
 |
|
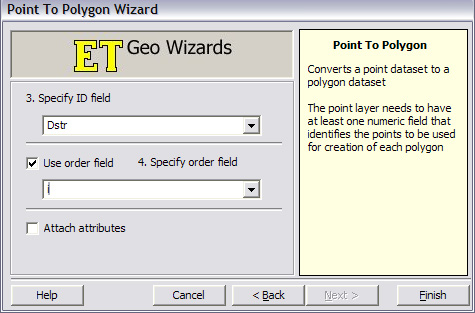
Now, one needs to provide details of the fields to use for the conversion process. Each feature class has an unique identifier, located at the end of the list of fields in the drop-down box provided for "Specify ID field". For instance, for the XYtimespacedeformation feature class, this field is called "Dstr". Each rectangle on the finished time-space correlation chart (called a polygon in GIS terminology) is defined by a series of nodes, arranged anticlockwise. The order of these nodes for each polygon is stored in field "i" in the XYtimespace... feature class. Select the appropriate field in the drop-down box labelled "Use order field". Leave the checkbox "Attach Attributes" unchecked. Click on the "Next"button. |
|
 |
|
If all has worked as it should, you will see the following window. |
|
 |
|
| Repeat this process for each of the XYtimespace.. feature classes that need to be converted to polygon feature classes. |
|
| Once you have converted all the necessary point feature classes (4 of them) to polygon feature classes, you are ready to view you chart. Close the map currently open in ArcMap (no need to save it), and open ChartTimeSpace.mxd. You should now see all your data from the IGCP509/StratDB database, organised in the standard IGCP 509 time-space correlation chart format. The layout is designed to allow regional coordinators to insert a GIS locality map to illustrate where the different structural domains are situated. An appropriate data frame is provided for this purpose. The time-space correlation chart may be further annotated, using ARCGIS 9.x or users may export the chart for use in a number of commercial graphics packages. An example of a time-space correlation chart (using hypothetical data), produced in this way and converted to an Adobe pdf using the MAP2PDF plugin for ARCGIS, may be downloaded. PDF files produced with MAP2PDF allow users to interactively select different layers so as to view the correlation charts in different ways. |
|
Master / Example Tables and Files
| The following tables and files may be used with ArcExplorer or with ARCGIS 9.x (ArcView) to view and/or modify an example time-space correlation chart based on hypothetical lithostratigraphic information from the "Undefined" continent in the IGCP509/StratDB database. Units are associated with three ficticious domains, as are several metamorphic and deformation events. | |