
General Structure
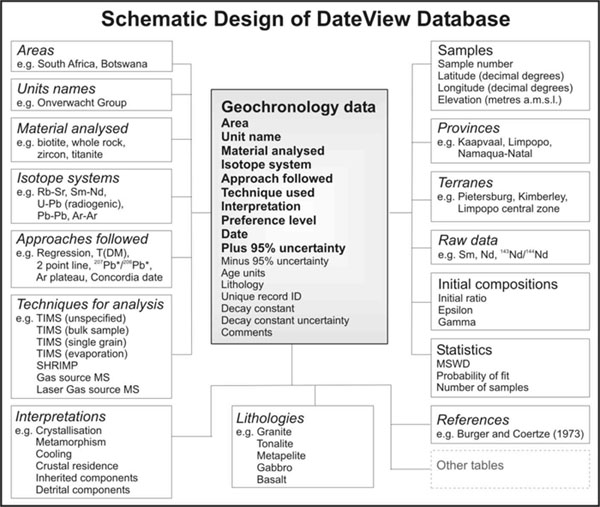
| The DateView database has been developed using a standard open-source relational database management system (Firebird) and the interface has been developed using the Delphi programing language and Intraweb components. The table structure is designed to ensure referential integrity i.e. to ensure that typographic errors are minimised. The diagram below illustrates the structure of the database in a semi-conceptual sense. |
|
 |
|
| A main database table contains the principle information, but is supported by other, linked tables (bold, normal font in the diagram above). Numerous 'lookup' tables ensure referential integrity (bold, italic font in the diagam above). |
Log in to DateView
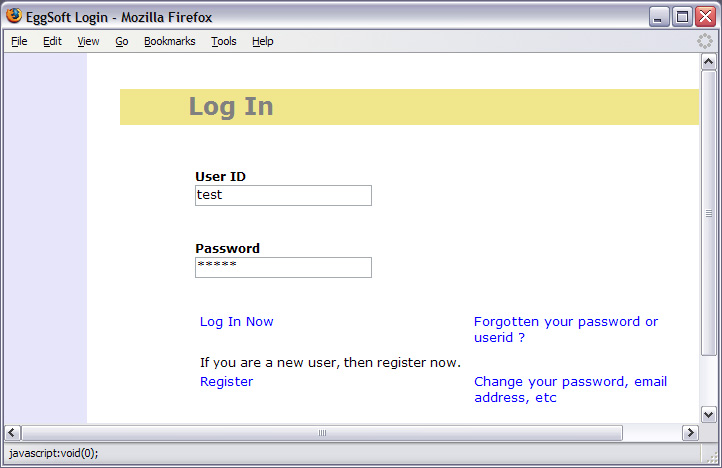
| In order to access the DateView database system, one first needs to login. |
|
 |
|
| First-time users will need to register. Login and registration is required in order to control access permissions for different users. For instance, not all users need to modify records or insert new records. Some users have the added responsibility of validating records in the database. Users should also ensure that they log out from the interface so that their most recent query design is stored and remembered for the next time they use the system. The default permission for new users is read-only. If this needs to be changed, please contact Bruce Eglington and specify your UserID in the email. |
|
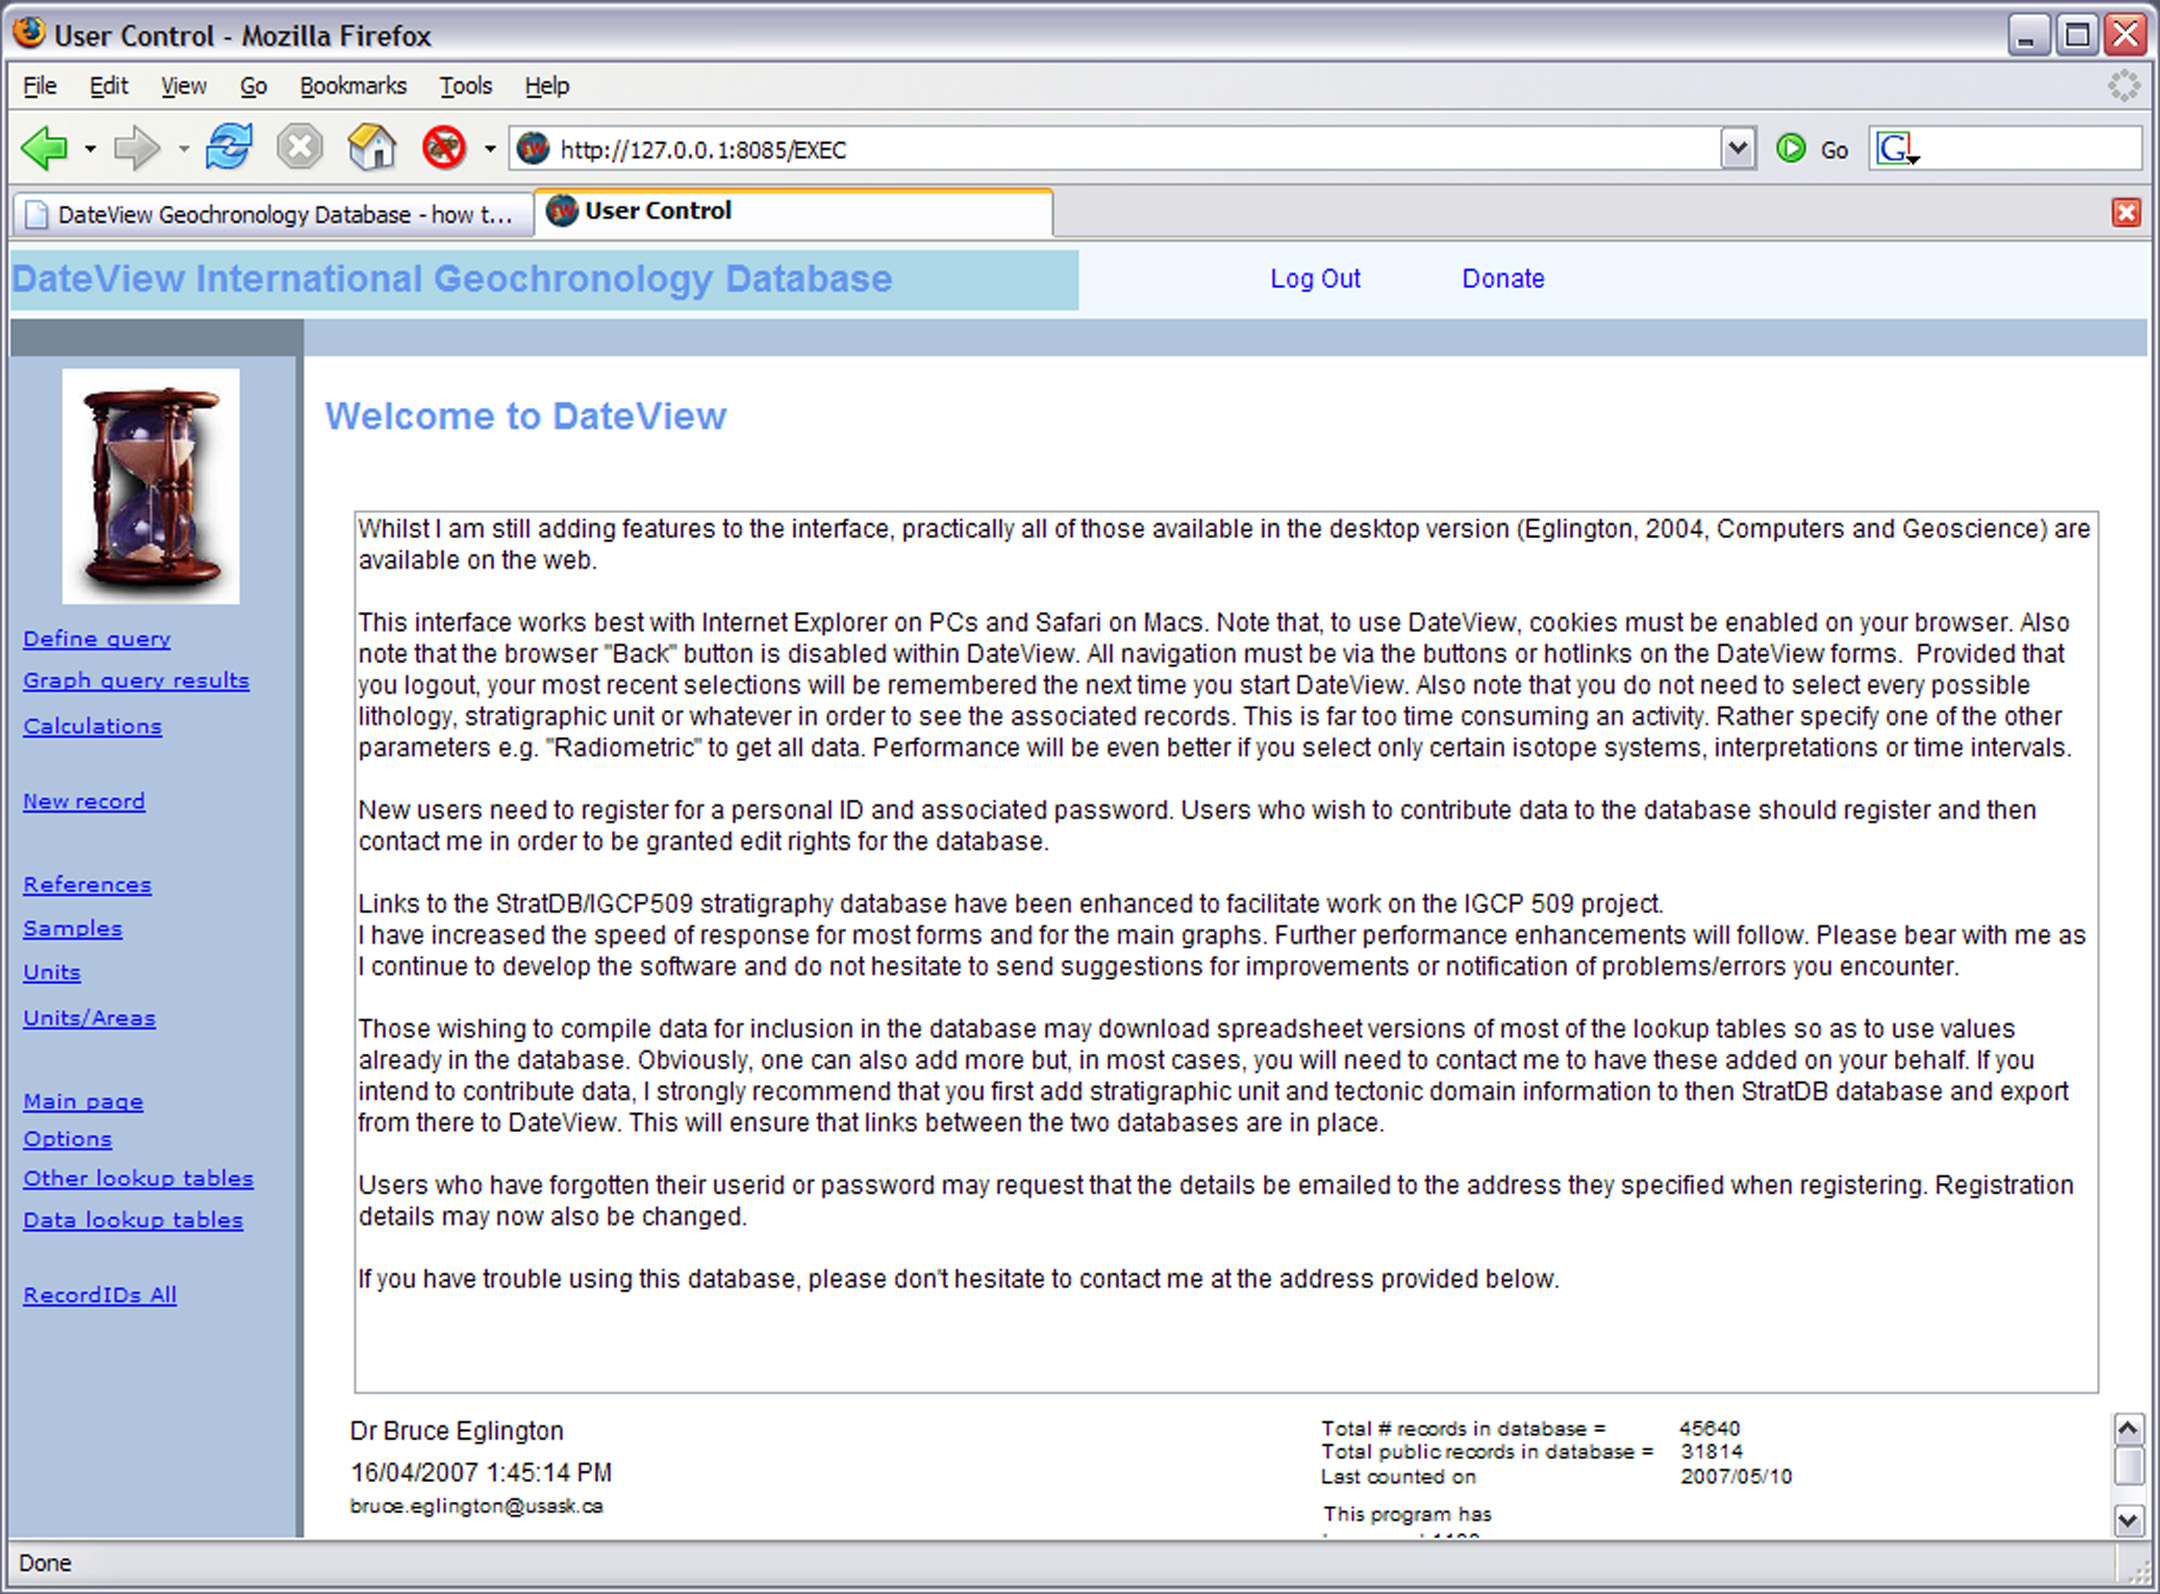
| You will then be taken to the main form from which one can define options, run a query, create graphs of the results of queries, or access the contents of the various lookup tables. |
|
 |
Define a Query
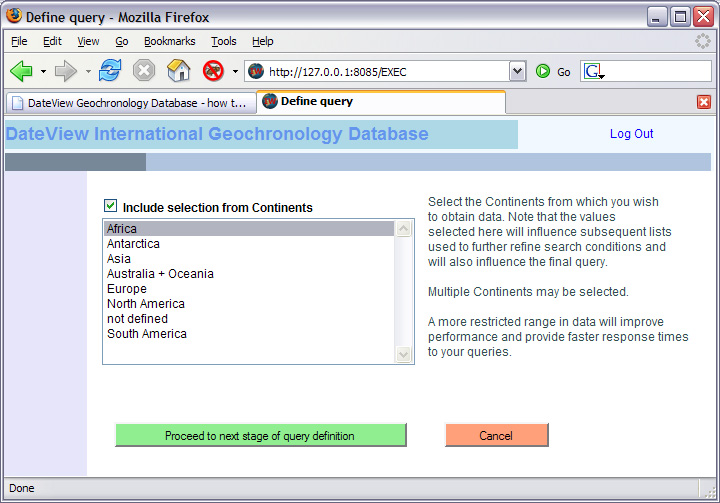
| Query definition occurs in three steps. first, one needs to define the continents within which to search. |
|
 |
|
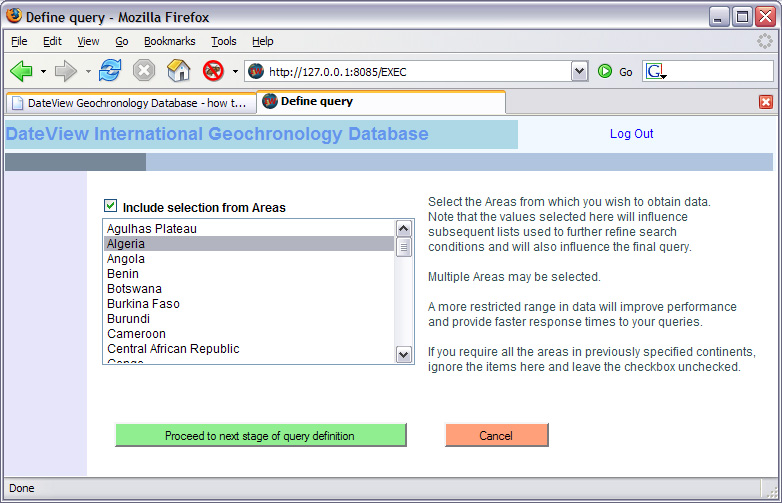
| Then one needs to select areas (countries) which are expected to contain the data one wants. If no countries are selected, then all stratigraphic units in all the continents specified will form the basis of the third form. |
|
 |
|
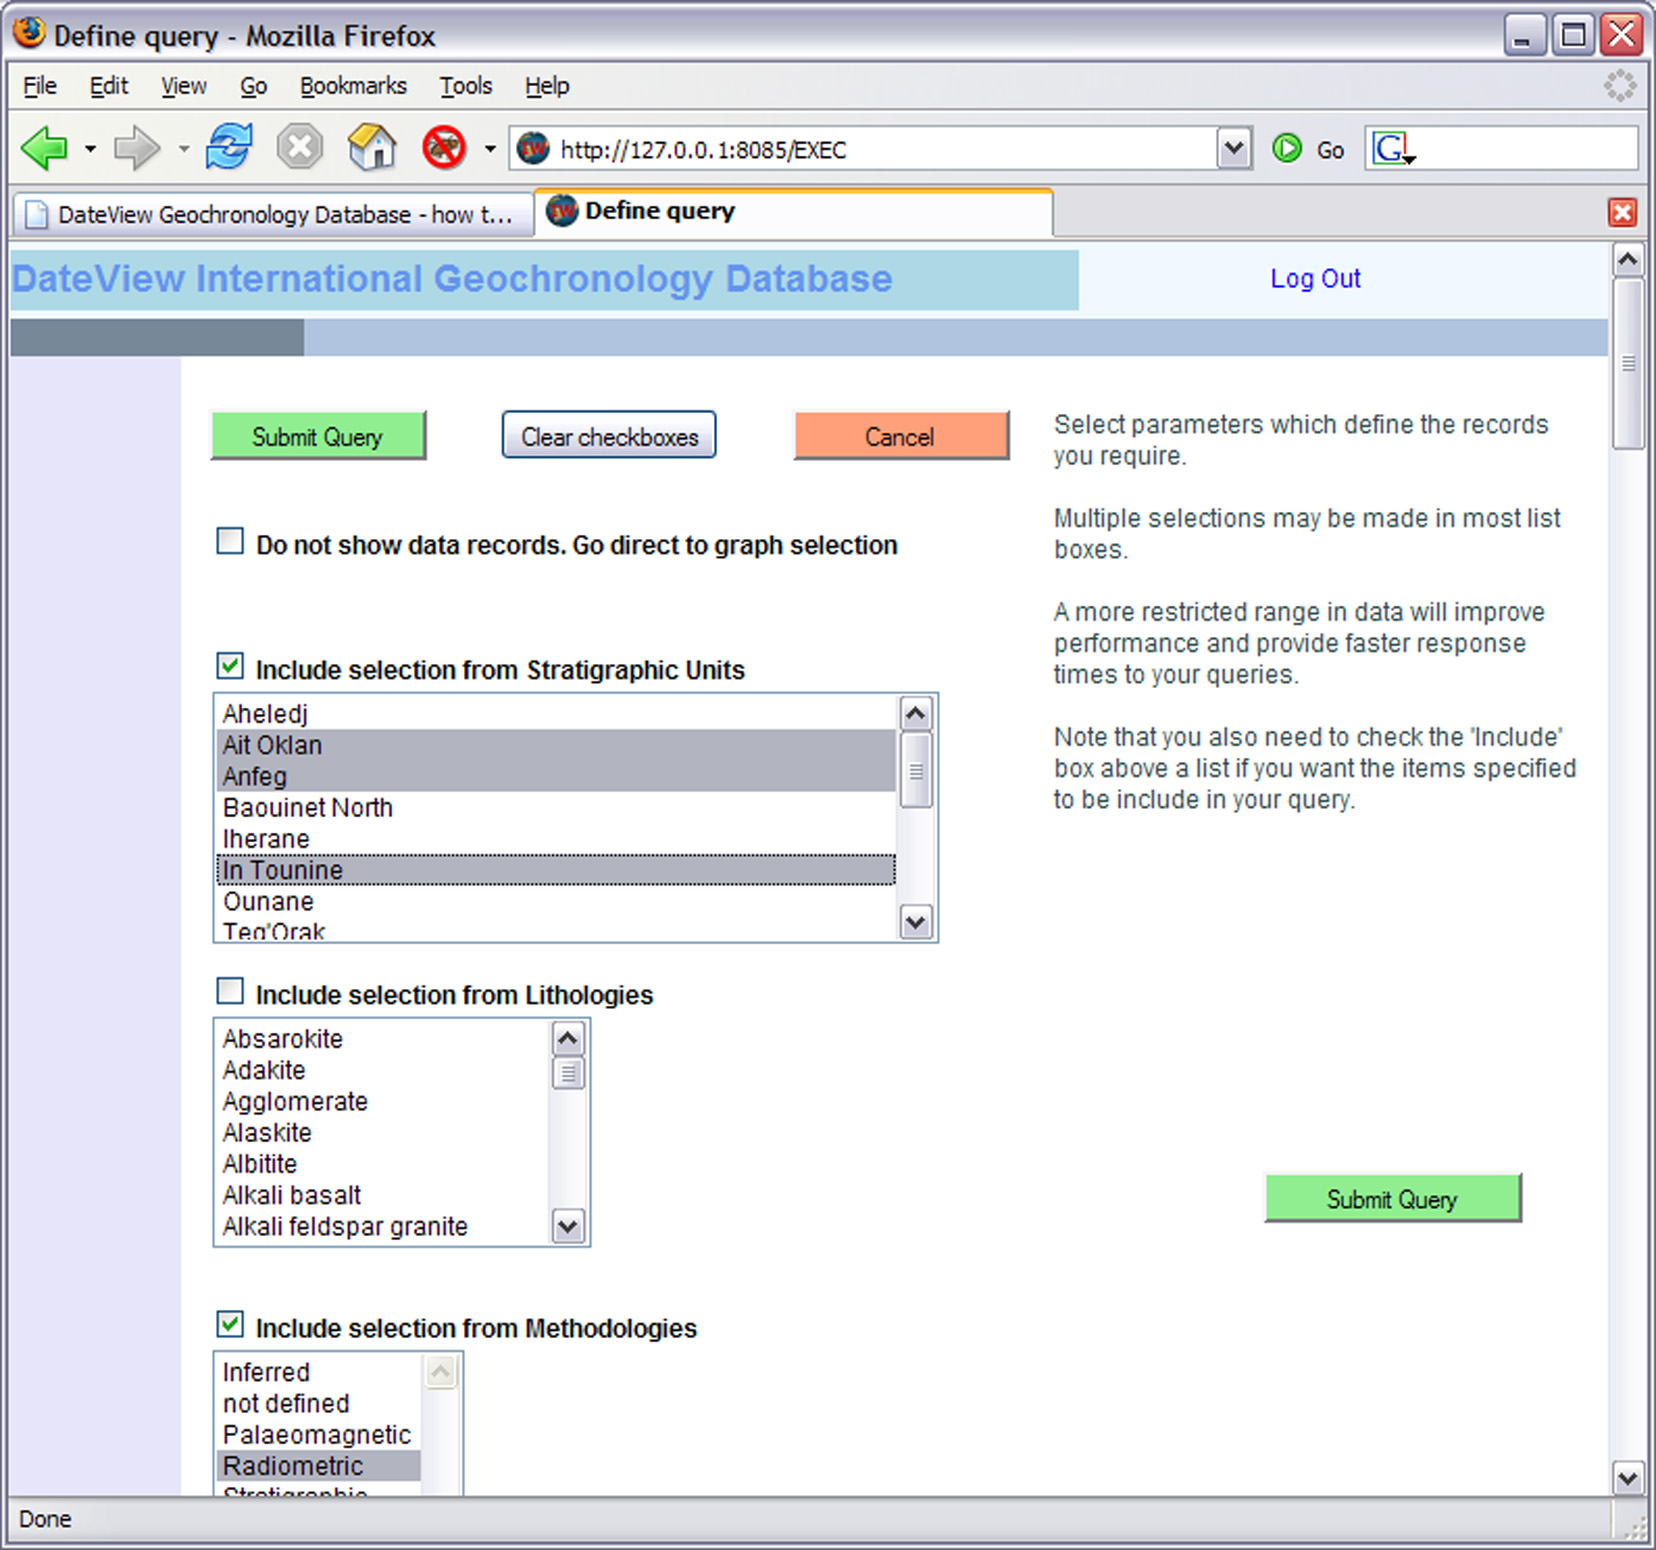
| This brings one to a form in which one can select from a list of stratigraphic units, material analysed, interpretation, structural province, and many more. |
|
 |
Query Results
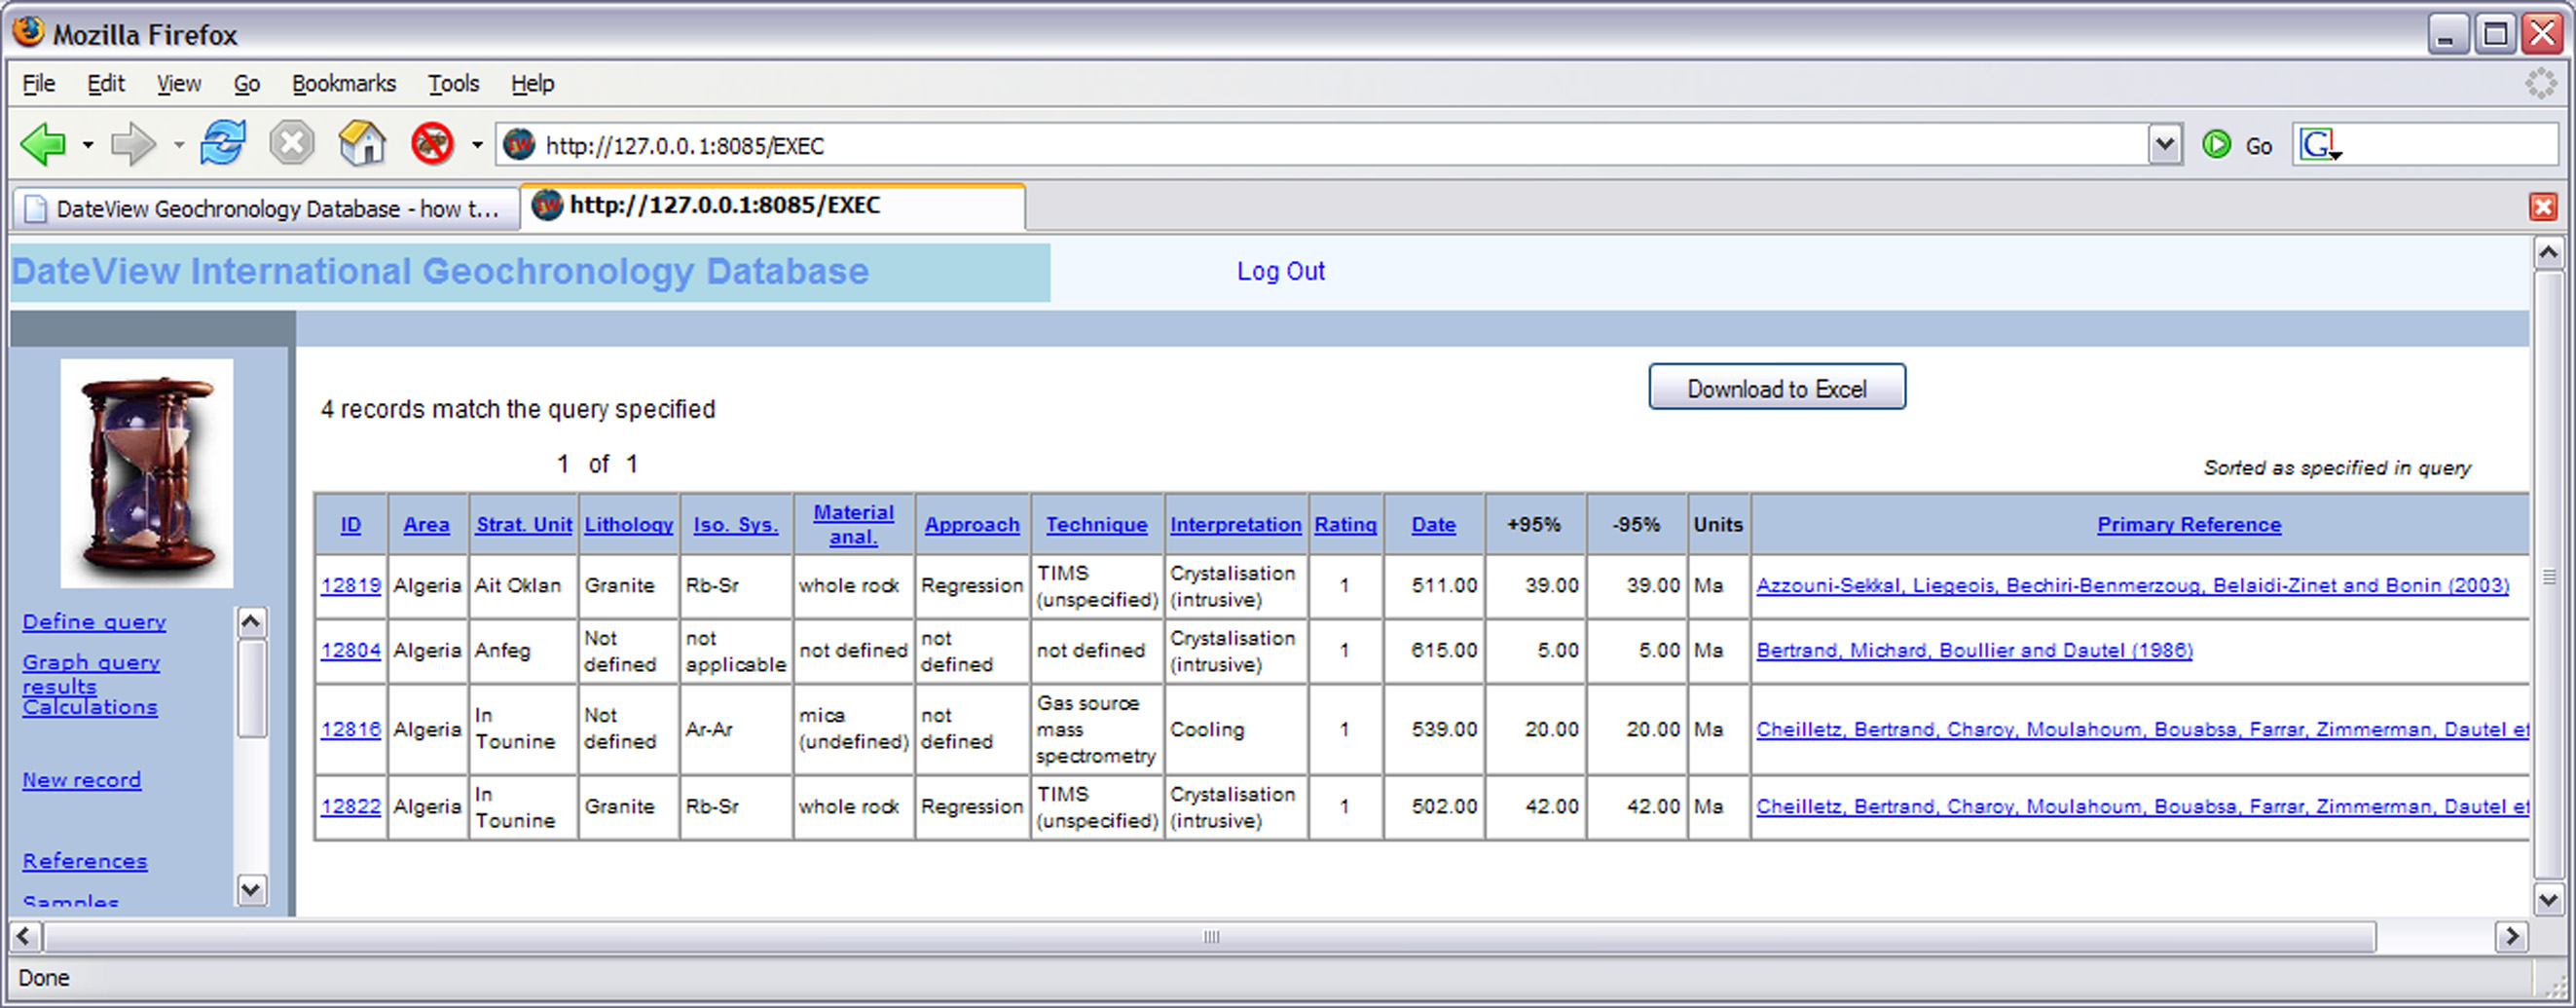
| The results of the query are presented in a summary table. One can click on the column title to resort the records or on a hotlink unique record identifier at the left of each row to proceed to more detailed information for the record. |
|
 |
Defining Options
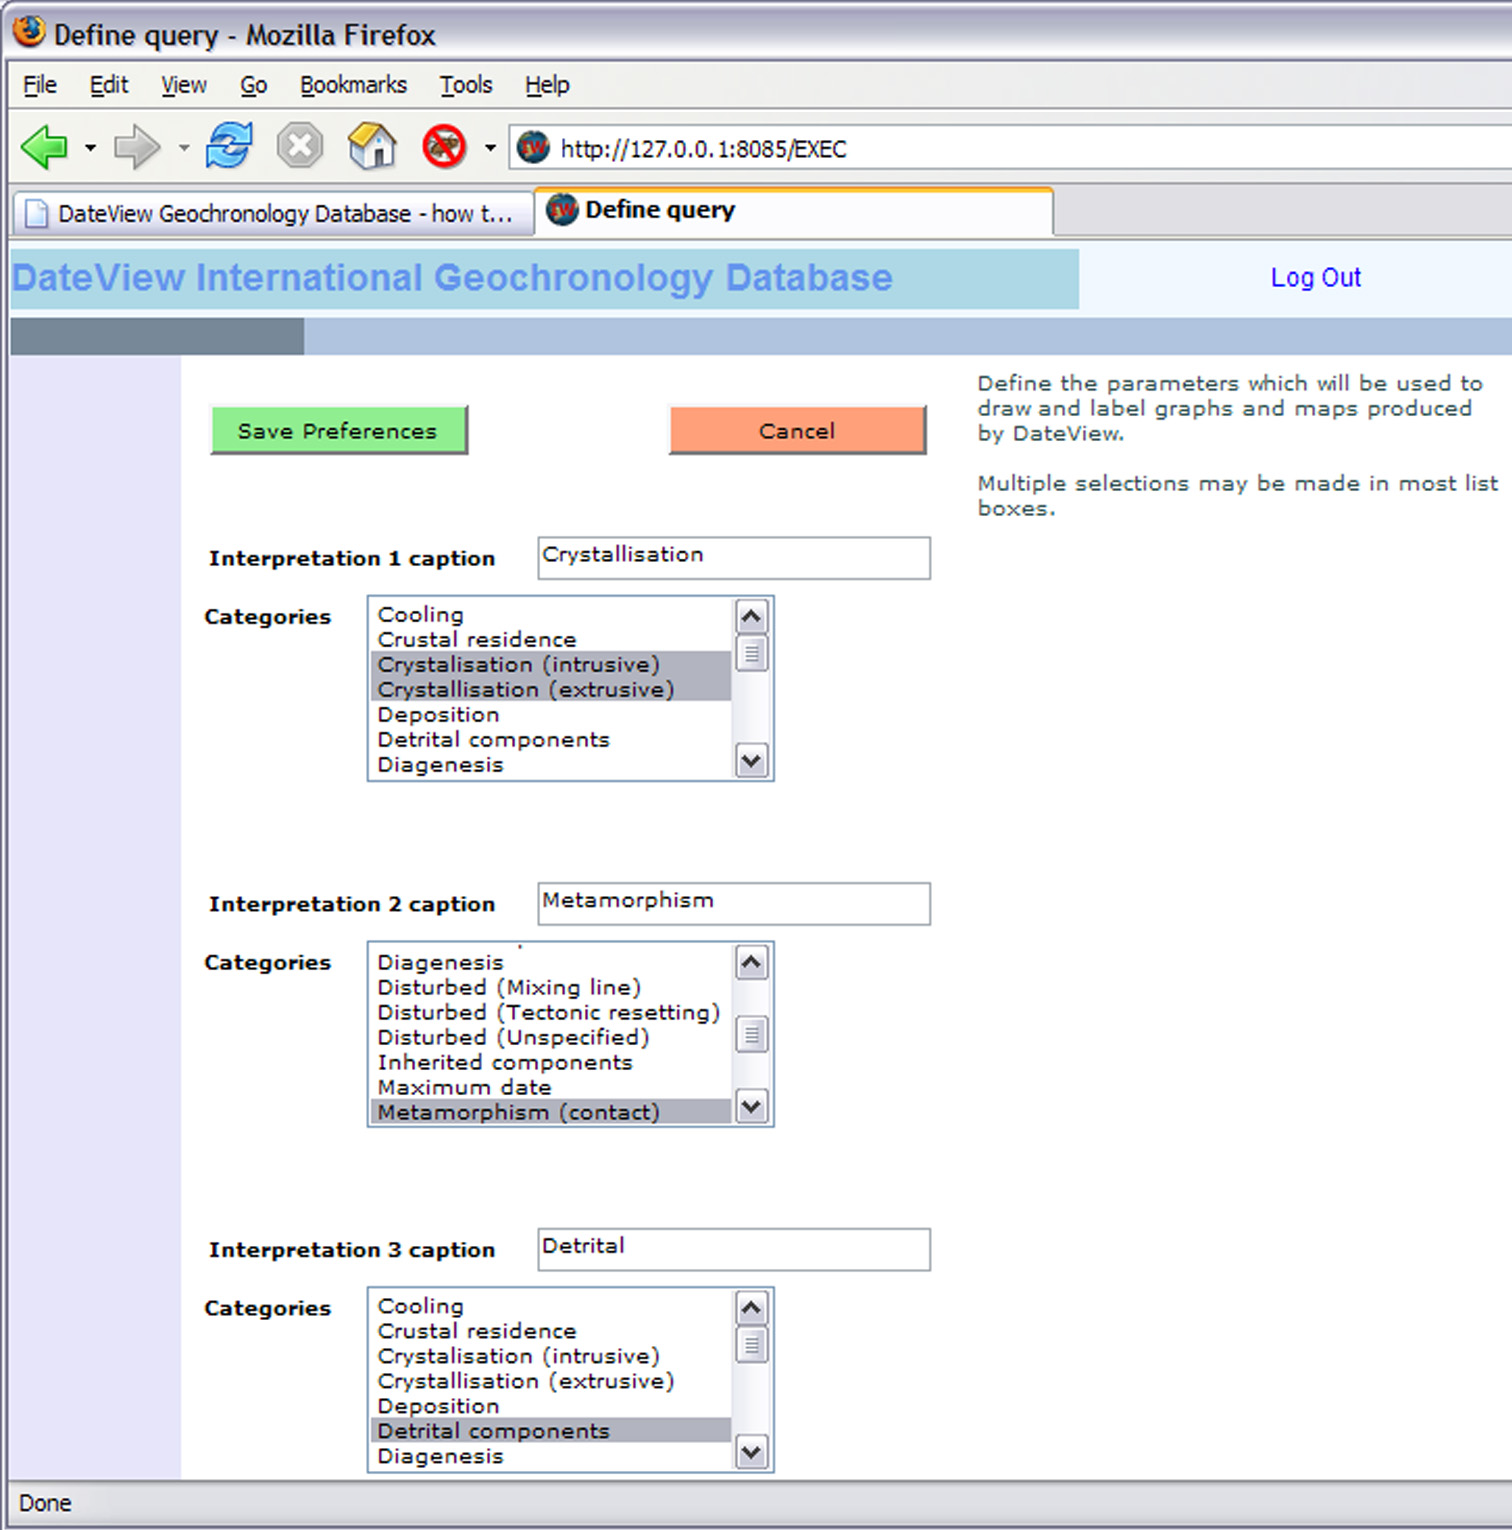
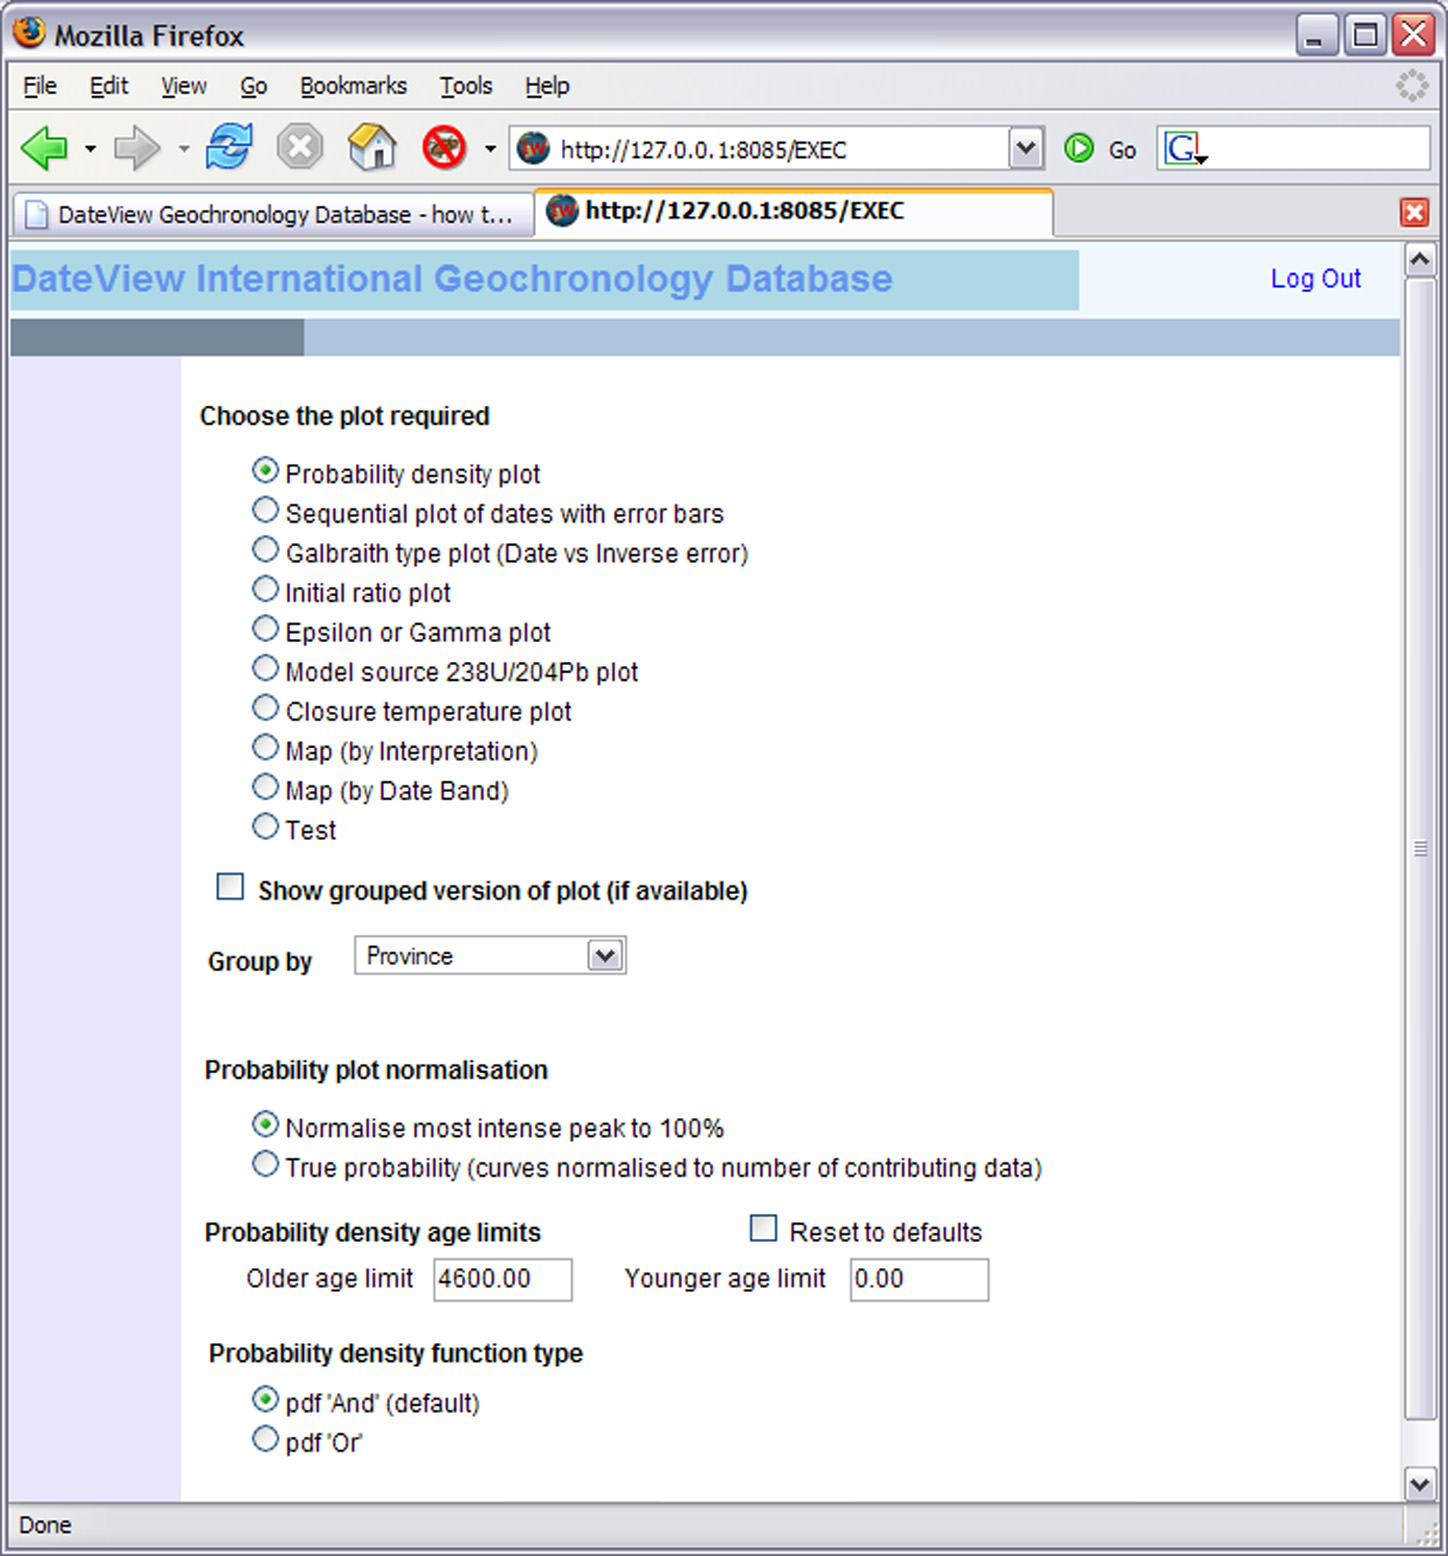
| If one has not already done so, one may define a variety of options which control how graphs are to be created. To do so, click on the Options hotlink at the left of the main form. Be sure to save your options before continuing. |
|
 |
Graphing Data
| If one chooses to graph the data selected, there are a number of ways to do this. |
|
 |
|
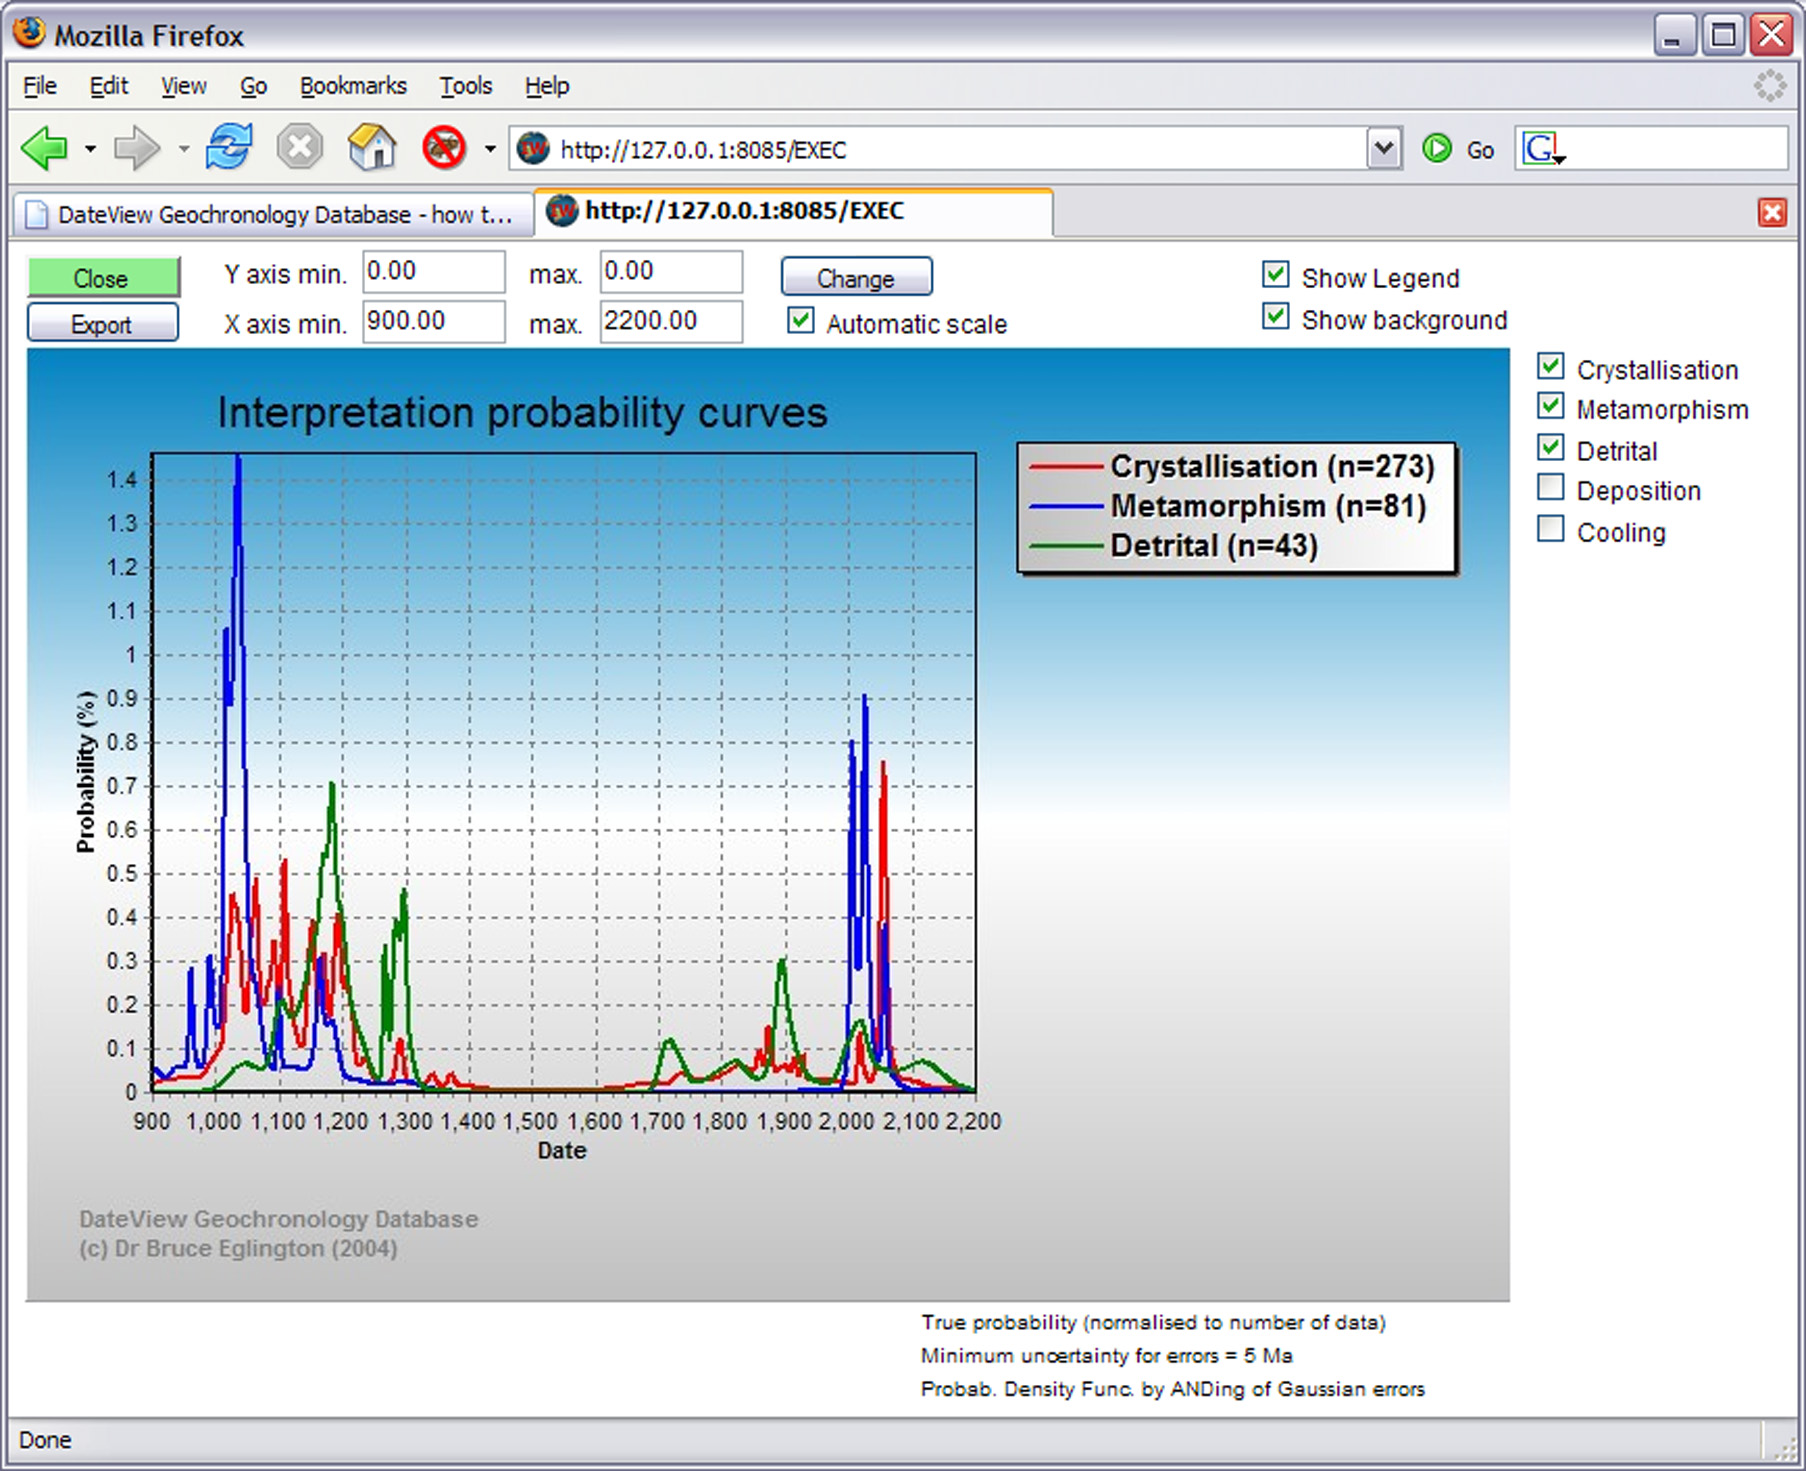
| One may graph the dates selected in the form of a probability distribution function and may choose to modify the axis limits or (for users with 'Plus' permissions') omit particular interpretation categories from the graph. |
|
 |
|
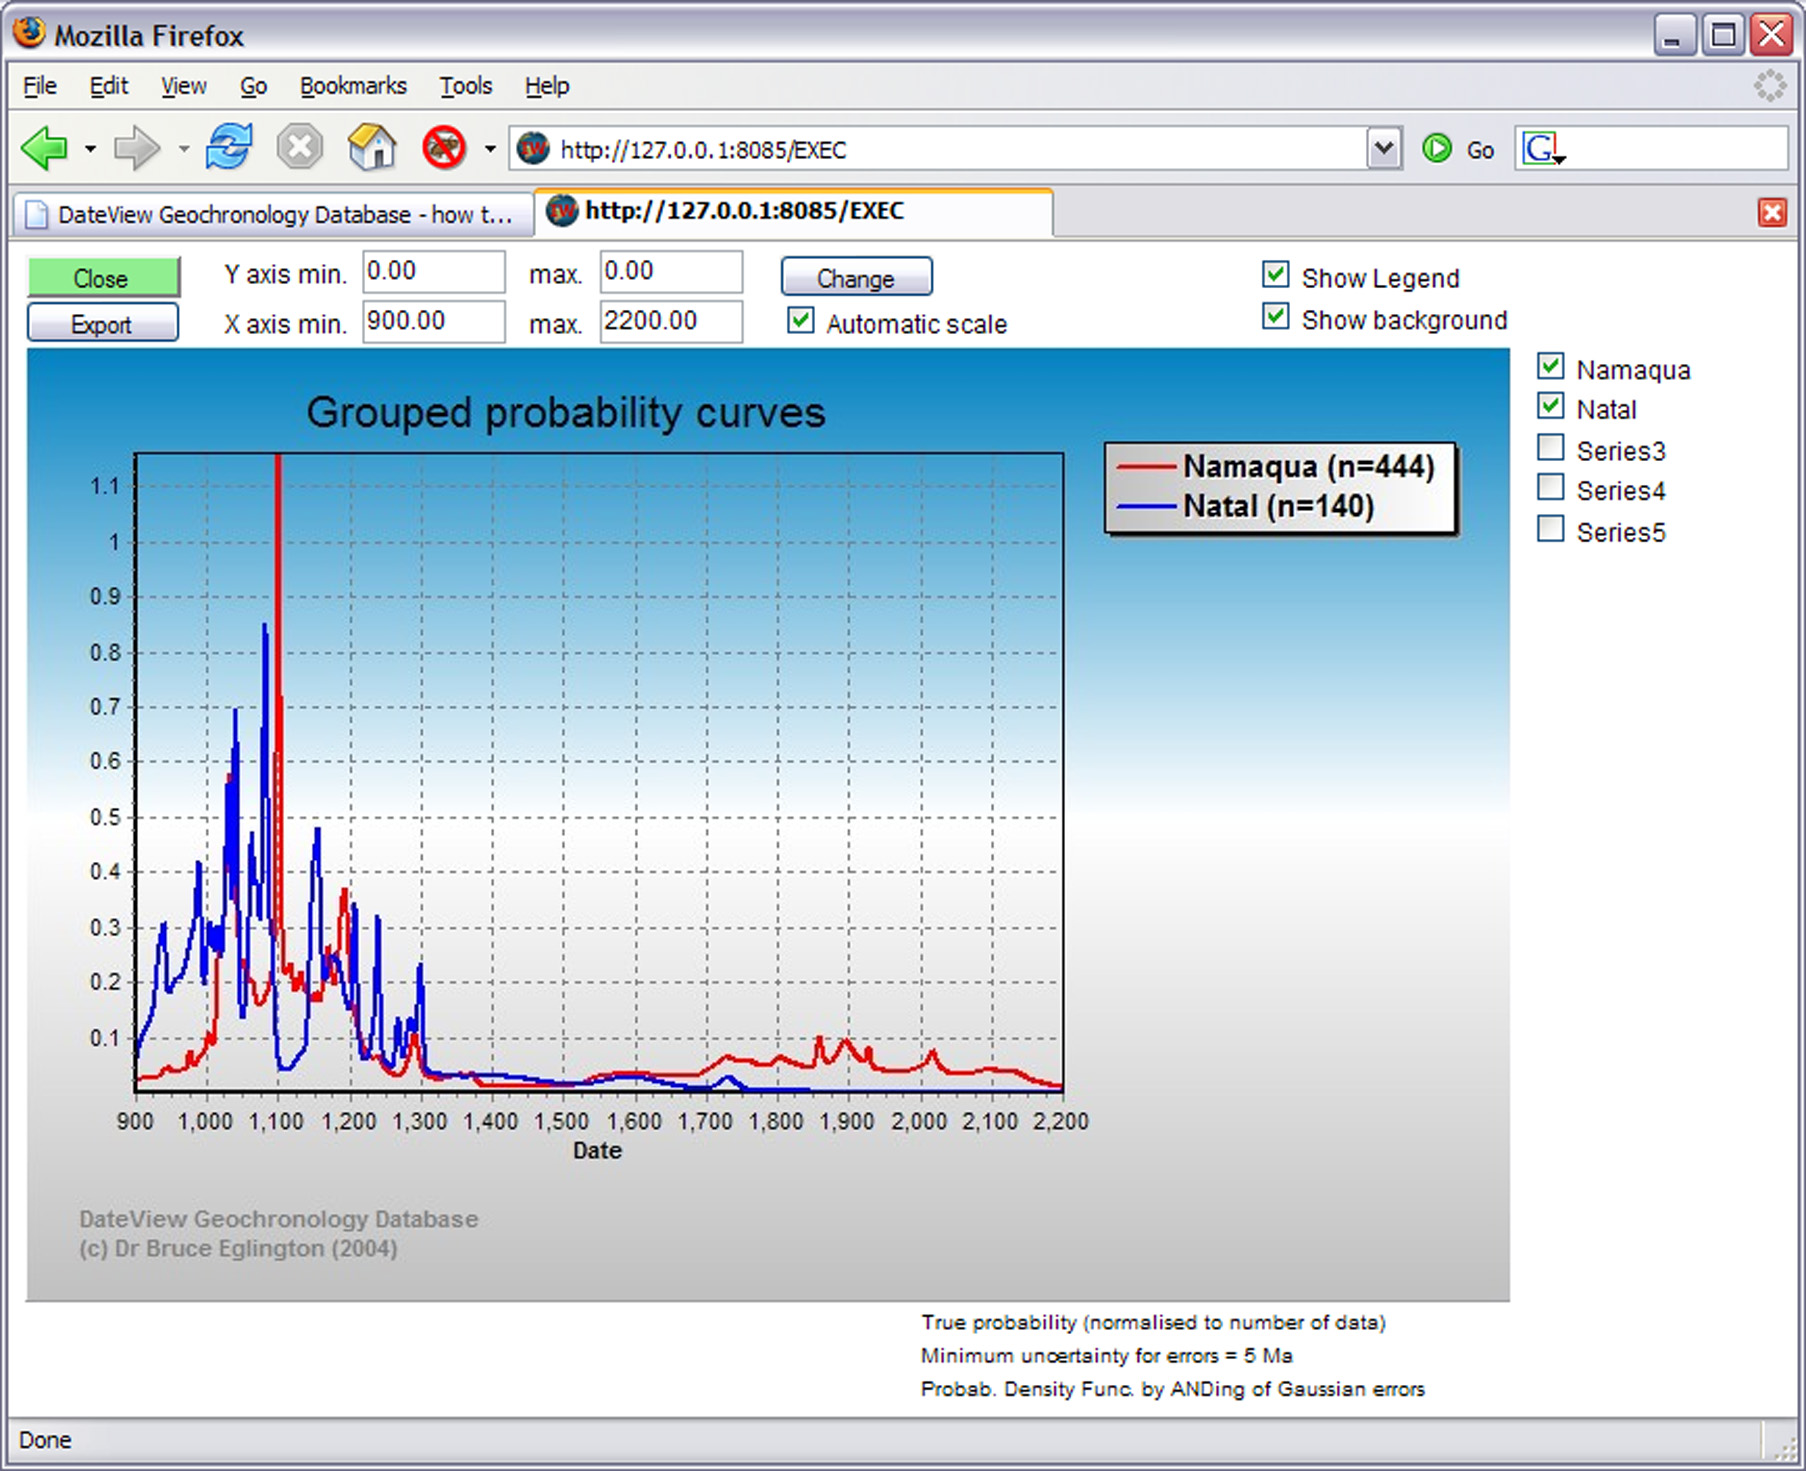
| If the data selection is based on one of the grouping categories (structural provinces, terranes, geochemical association, tectonic association, etc), one can choose to compare these assocaitions. The following graph does this for two structural domains from the Mesoproterozoic of southern Africa. |
|
 |
|
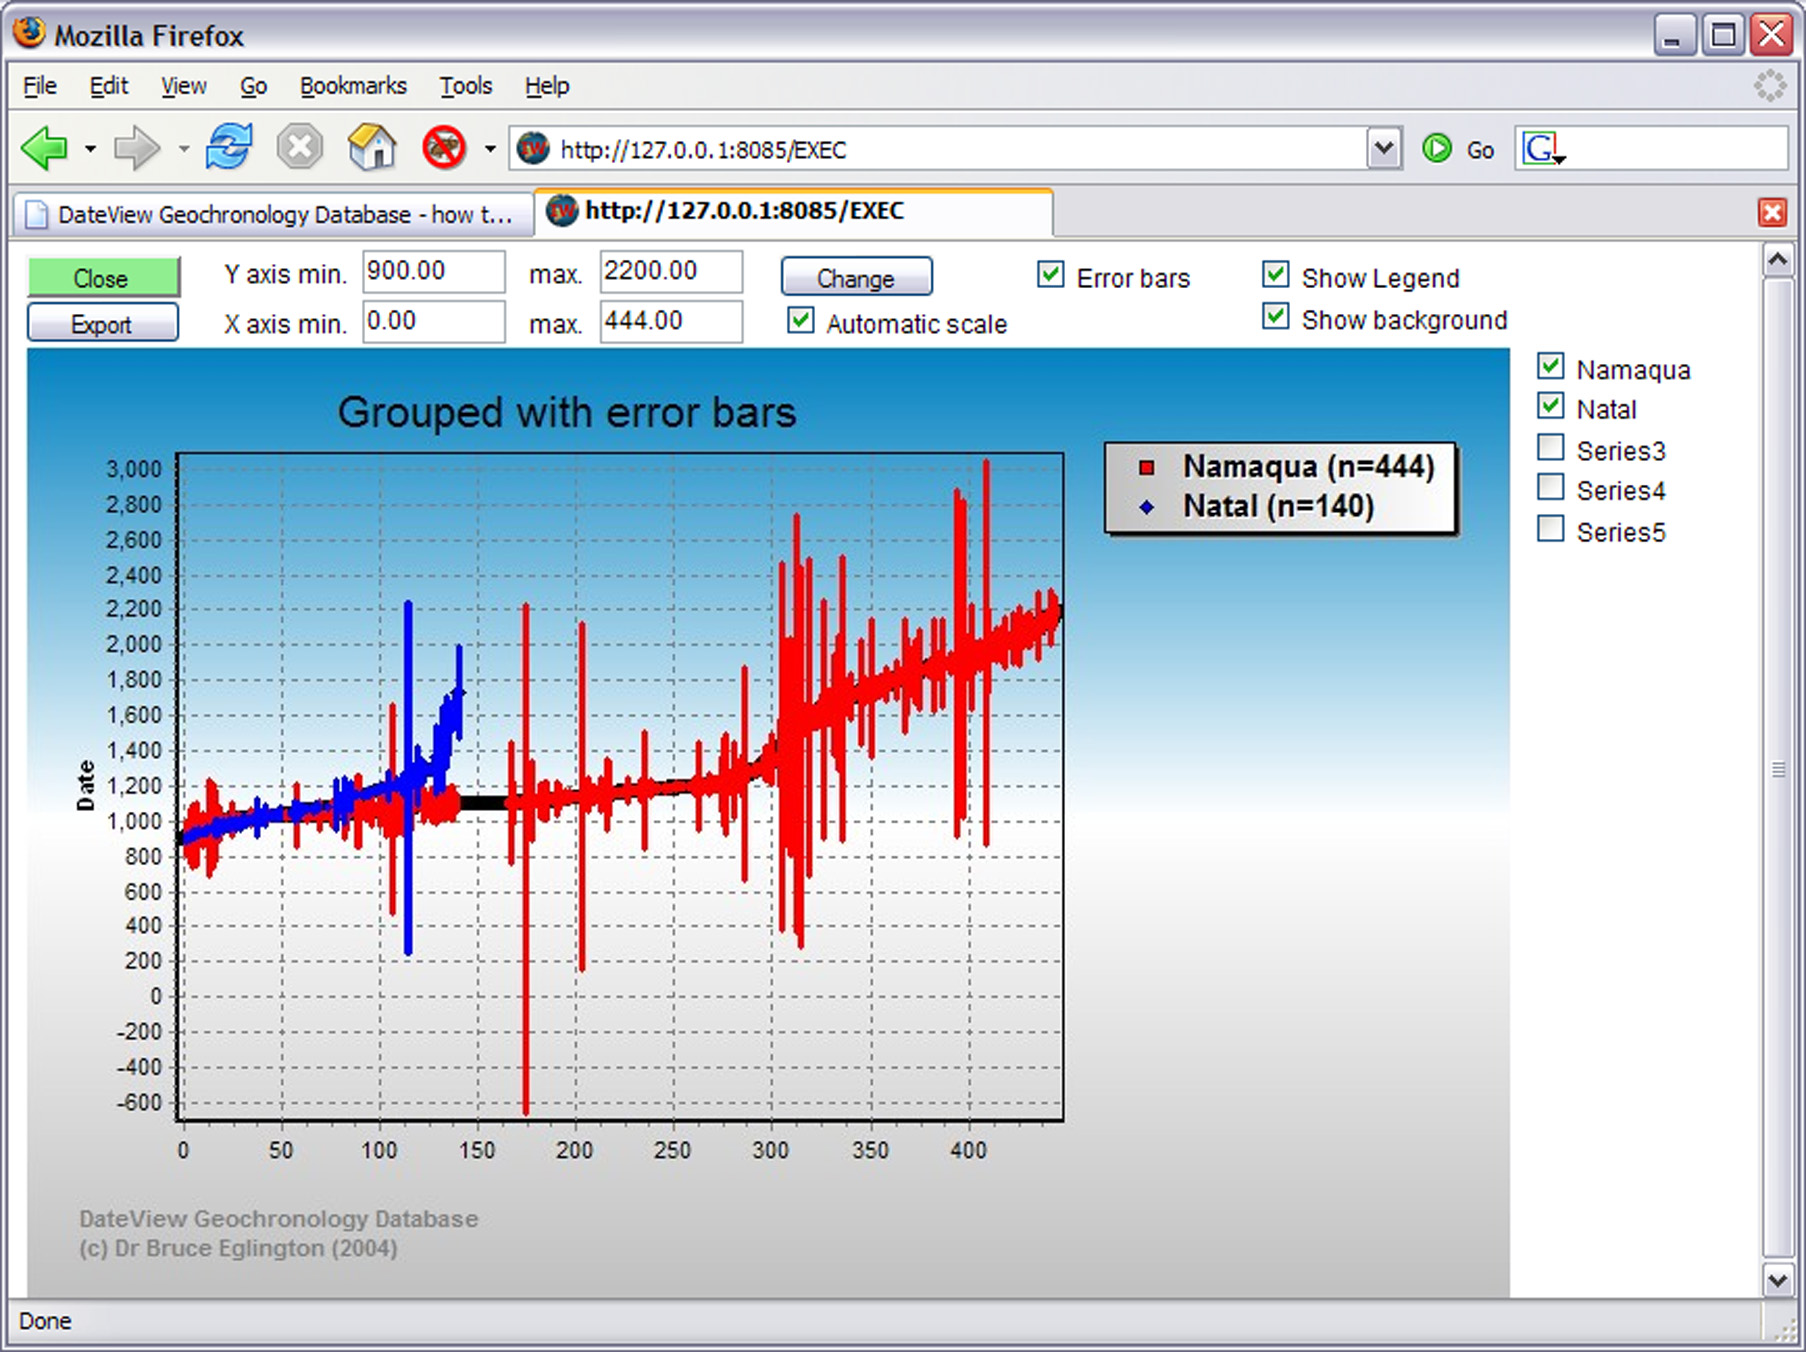
| It is also possible to graph data as symbols with error bars. The graph below illustrates the same data as shown in the pdf above. |
|
 |
|
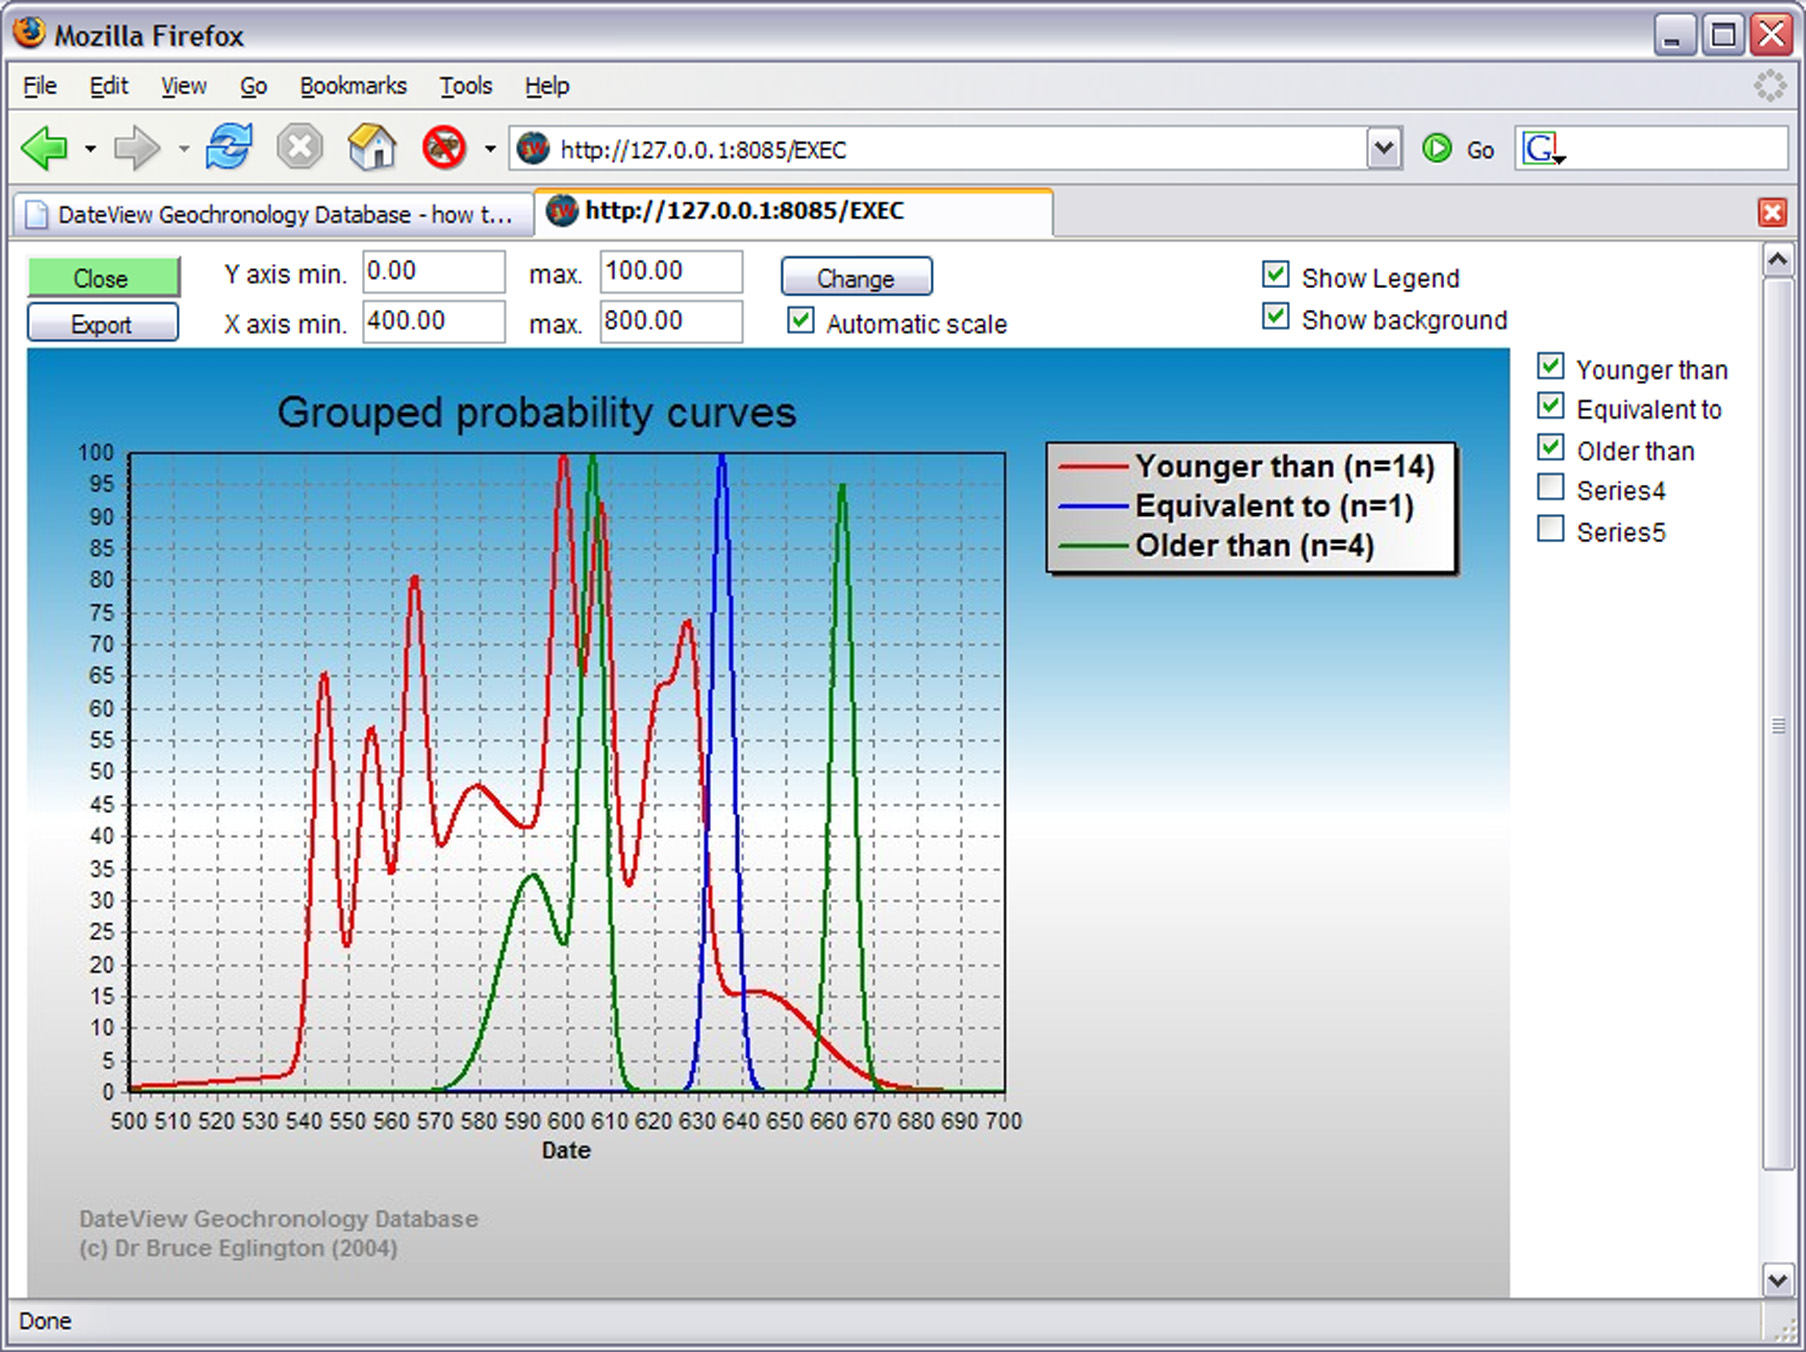
| If one has selected data grouped by a specific boundary, one can graph these dates according to whether they preceed, succeed or coincide with the boundary, as shown below for some dates for the Marinoan glaciation. With this approach, it is easy to identify dates which contradict others. |
|
 |
|
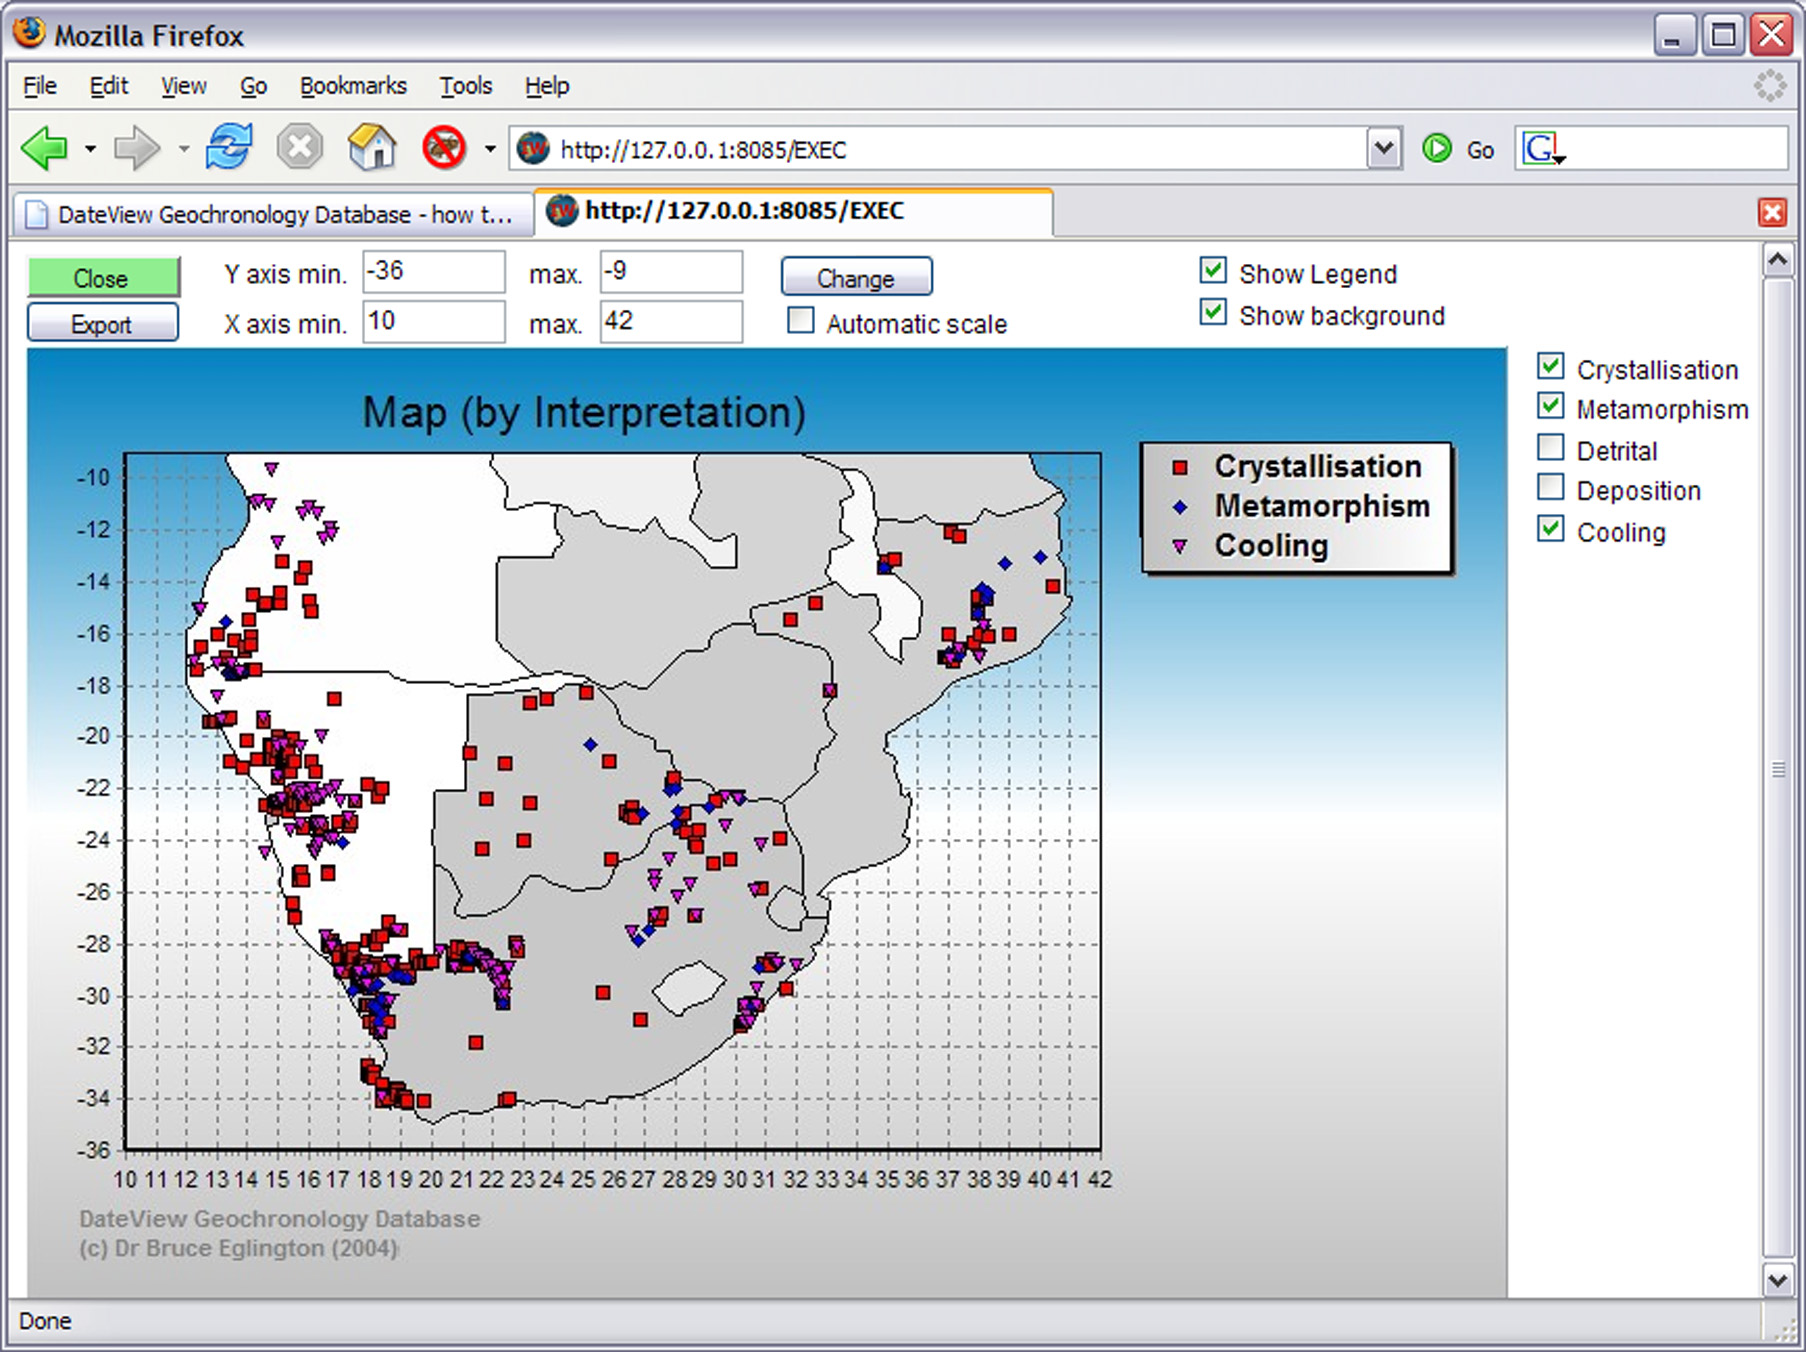
| Data may also be graphed on a pseudo-map, utilising the same interpretations as in some of the graphs above. If all areas selected are from one continent, then the continent and its countries are provided as a backdrop to the point data. Users may zoom in to particular latitude-longitude regions. |
|
 |
|
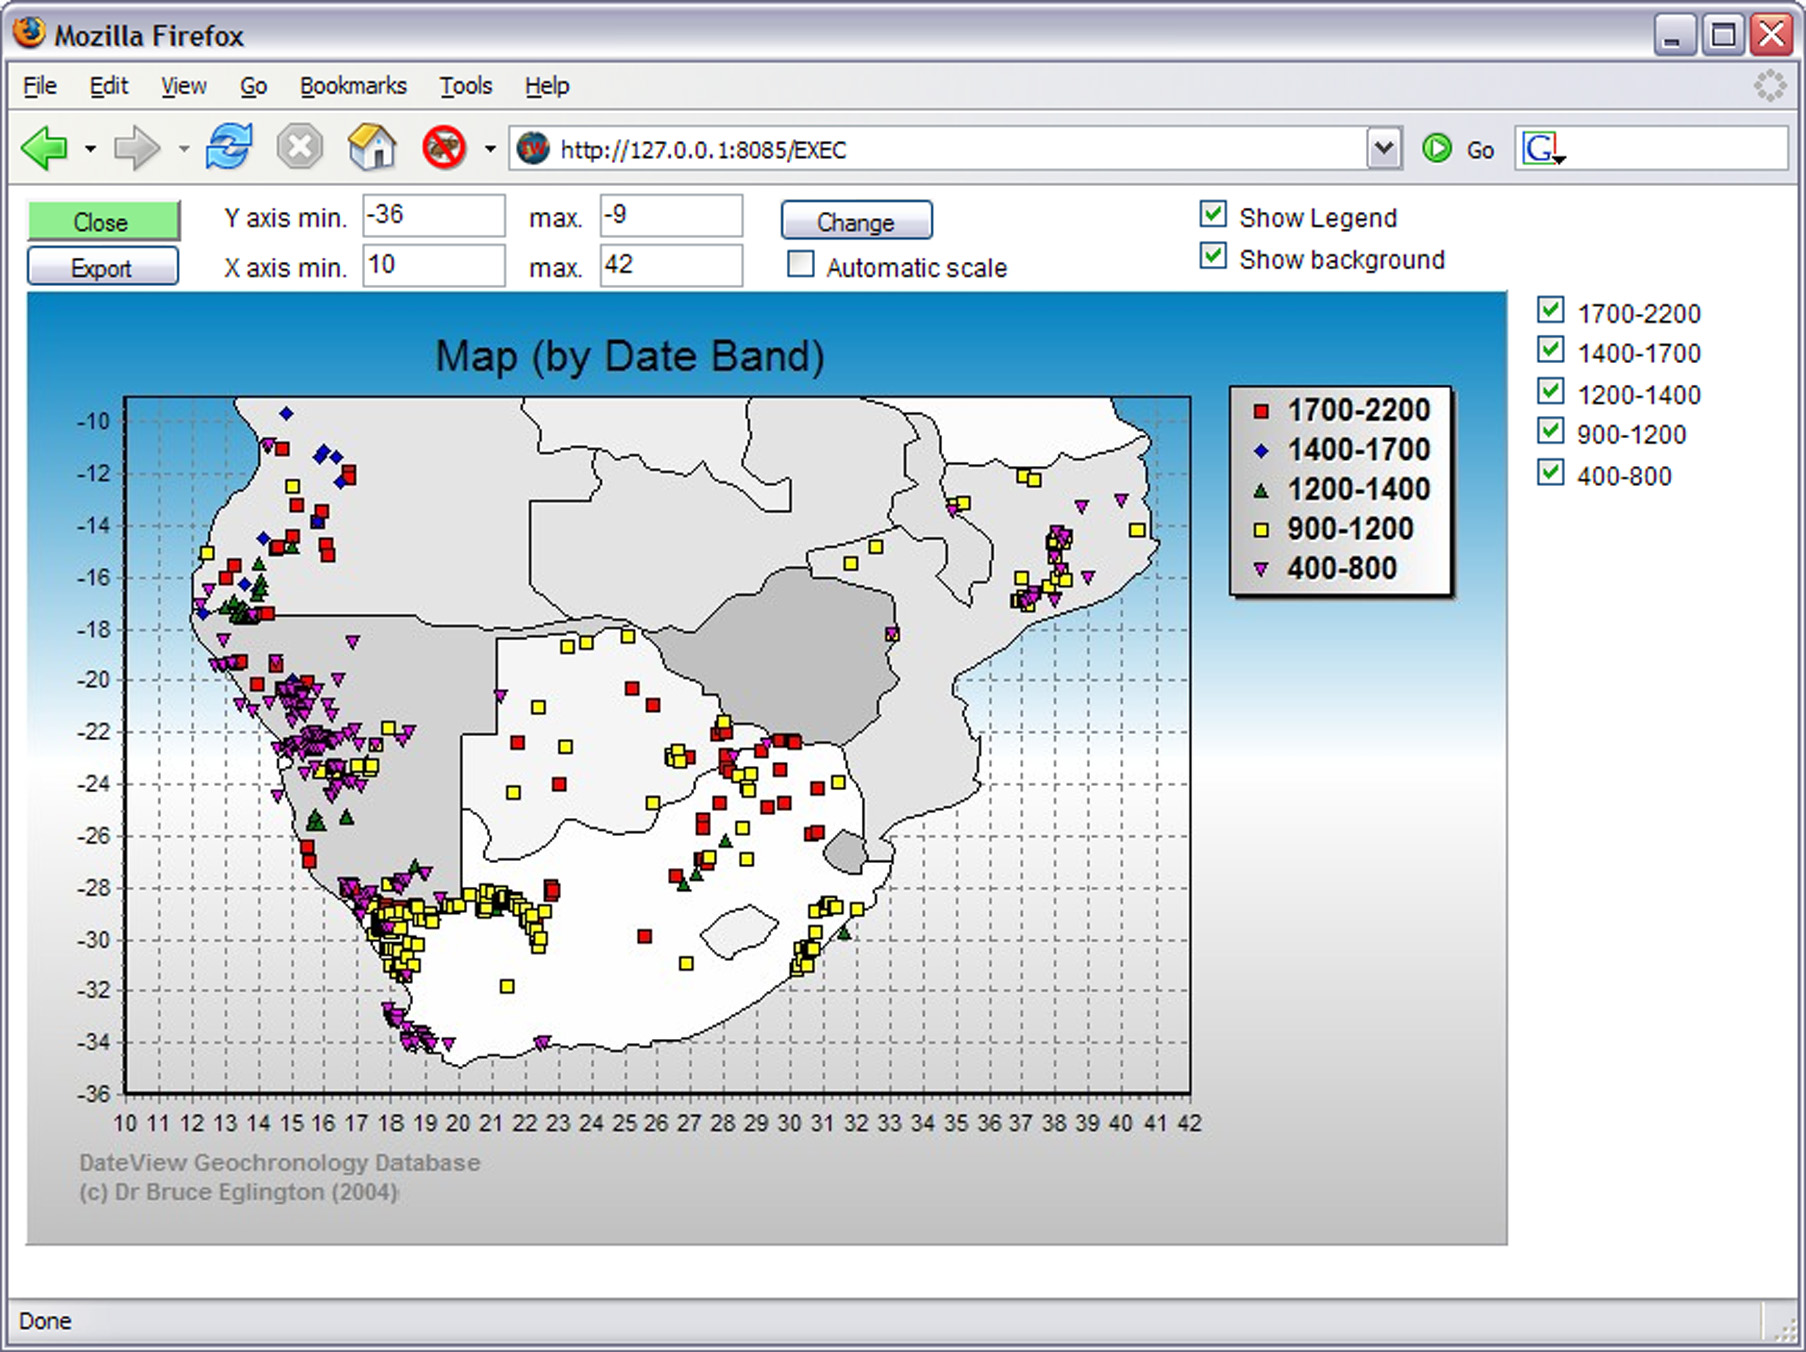
| It is also possible to illustrate the data on a pseudo-map graph with symbols based on the five user-defined date bands. |
|
 |
|
| Raw data may also be collated in DateView and will be used for additional graphs in future. |